## Line Graphs: Test Loss vs. Parameters (Embedding vs. Non-Embedding)
### Overview
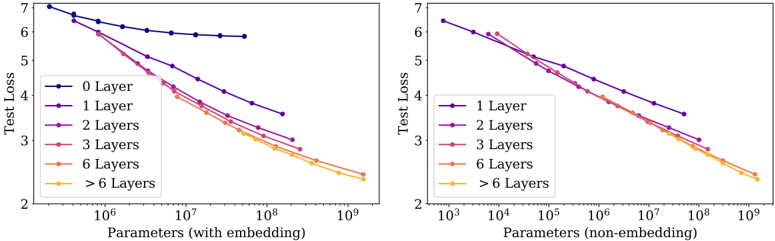
The image contains two side-by-side line graphs comparing test loss performance across different neural network layer configurations. The left graph shows results for models with embedding layers, while the right graph shows results for models without embedding layers. Both graphs plot test loss (y-axis) against the number of parameters (x-axis, logarithmic scale).
### Components/Axes
**Left Graph (With Embedding):**
- **X-axis**: Parameters (with embedding) [10⁶ to 10⁹]
- **Y-axis**: Test Loss [2 to 7]
- **Legend**:
- 0 Layer (dark blue)
- 1 Layer (purple)
- 2 Layers (pink)
- 3 Layers (red)
- 6 Layers (orange)
- >6 Layers (yellow)
**Right Graph (Non-Embedding):**
- **X-axis**: Parameters (non-embedding) [10³ to 10⁹]
- **Y-axis**: Test Loss [2 to 7]
- **Legend**:
- 1 Layer (dark blue)
- 2 Layers (purple)
- 3 Layers (pink)
- 6 Layers (orange)
- >6 Layers (yellow)
### Detailed Analysis
**Left Graph Trends:**
- 0 Layer (dark blue): Flat line at ~6.8 test loss (no parameter dependence)
- 1 Layer (purple): Steep decline from ~6.5 to ~3.2 as parameters increase
- 2 Layers (pink): Gradual decline from ~6.0 to ~2.8
- 3 Layers (red): Moderate decline from ~5.5 to ~2.5
- 6 Layers (orange): Steady decline from ~5.0 to ~2.2
- >6 Layers (yellow): Slight decline from ~4.8 to ~2.1
**Right Graph Trends:**
- 1 Layer (dark blue): Sharp decline from ~6.5 to ~3.0
- 2 Layers (purple): Steep decline from ~6.0 to ~2.8
- 3 Layers (pink): Gradual decline from ~5.5 to ~2.5
- 6 Layers (orange): Steady decline from ~5.0 to ~2.2
- >6 Layers (yellow): Slight decline from ~4.8 to ~2.1
### Key Observations
1. **Embedding vs. Non-Embedding**:
- The non-embedding graph starts at 1 Layer (no 0 Layer baseline)
- Both graphs show similar performance trends for ≥1 layers
- Embedding models require significantly more parameters (10⁶ vs. 10³ baseline)
2. **Layer Complexity**:
- Adding layers reduces test loss, but diminishing returns occur after 6 layers
- >6 Layers show minimal improvement despite increased parameter count
3. **Parameter Efficiency**:
- Non-embedding models achieve similar performance with 100-1000x fewer parameters
- Embedding models require ~10⁶ parameters to reach ~2.2 test loss vs. ~10⁵ parameters for non-embedding
### Interpretation
The data demonstrates that:
- **Embedding layers** significantly increase parameter requirements but enable more complex architectures
- **Layer count** has a logarithmic relationship with test loss improvement
- **Diminishing returns** occur after 6 layers in both configurations
- **Non-embedding models** achieve comparable performance with fewer parameters, suggesting embeddings may introduce unnecessary complexity for simpler tasks
The flat 0 Layer line in the embedding graph indicates a potential baseline model (e.g., a simple classifier) that doesn't benefit from additional parameters. The convergence of >6 Layers lines suggests architectural saturation points where adding more layers provides minimal benefit.