\n
## Bar Chart: Prediction Flip Rate Comparison for Mistral Models
### Overview
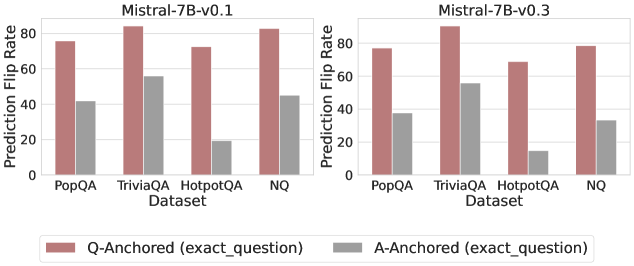
This image presents a comparative bar chart illustrating the Prediction Flip Rate for two versions of the Mistral-7B model (v0.1 and v0.3) across four different datasets: PopQA, TriviaQA, HotpotQA, and NQ. The chart compares the flip rates for questions anchored to the original question ("Q-Anchored") versus those anchored to the answer ("A-Anchored").
### Components/Axes
* **X-axis:** Dataset - PopQA, TriviaQA, HotpotQA, NQ.
* **Y-axis:** Prediction Flip Rate - Scale ranges from 0 to 80.
* **Two Charts:** Side-by-side bar charts, one for Mistral-7B-v0.1 and one for Mistral-7B-v0.3.
* **Legend:** Located at the bottom-center of the image.
* Red: Q-Anchored (exact\_question)
* Gray: A-Anchored (exact\_question)
* **Titles:** Each chart has a title indicating the model version: "Mistral-7B-v0.1" and "Mistral-7B-v0.3".
### Detailed Analysis
**Mistral-7B-v0.1 Chart:**
* **PopQA:** Q-Anchored: Approximately 72. A-Anchored: Approximately 32.
* **TriviaQA:** Q-Anchored: Approximately 80. A-Anchored: Approximately 52.
* **HotpotQA:** Q-Anchored: Approximately 72. A-Anchored: Approximately 24.
* **NQ:** Q-Anchored: Approximately 80. A-Anchored: Approximately 32.
**Mistral-7B-v0.3 Chart:**
* **PopQA:** Q-Anchored: Approximately 64. A-Anchored: Approximately 36.
* **TriviaQA:** Q-Anchored: Approximately 80. A-Anchored: Approximately 52.
* **HotpotQA:** Q-Anchored: Approximately 68. A-Anchored: Approximately 24.
* **NQ:** Q-Anchored: Approximately 76. A-Anchored: Approximately 32.
**Trends:**
* In both models, the Q-Anchored flip rate is consistently higher than the A-Anchored flip rate across all datasets.
* For both models, the highest Q-Anchored flip rates are observed for TriviaQA and NQ datasets, reaching approximately 80.
* The A-Anchored flip rates are generally lower, ranging from approximately 24 to 52.
* The v0.3 model shows a slight decrease in Q-Anchored flip rates compared to v0.1 for PopQA, HotpotQA, and NQ.
### Key Observations
* The difference between Q-Anchored and A-Anchored flip rates is substantial, suggesting that anchoring to the question significantly impacts prediction stability.
* TriviaQA and NQ datasets consistently elicit higher flip rates for Q-Anchored questions.
* HotpotQA consistently shows the lowest A-Anchored flip rate.
* The v0.3 model appears to be slightly more stable than v0.1 for some datasets (PopQA, HotpotQA, NQ) based on the lower Q-Anchored flip rates.
### Interpretation
The data suggests that the Mistral models are more sensitive to changes when the prediction is evaluated based on the original question (Q-Anchored) compared to when it's evaluated based on the answer (A-Anchored). This could indicate that the models rely more heavily on the question context during prediction. The higher flip rates for TriviaQA and NQ might be due to the complexity or ambiguity of the questions in these datasets. The slight decrease in Q-Anchored flip rates in v0.3 for certain datasets suggests a potential improvement in model stability with the newer version, although the difference is not drastic. The consistent lower A-Anchored flip rates across all datasets indicate that the model is more confident in its predictions when evaluated against the answer, potentially because the answer provides a stronger constraint. The difference in flip rates between Q-Anchored and A-Anchored could be a metric for evaluating the robustness of the model's reasoning process.