## Bar Chart: Prediction Flip Rate Comparison for Mistral-7B Models (v0.1 and v0.3)
### Overview
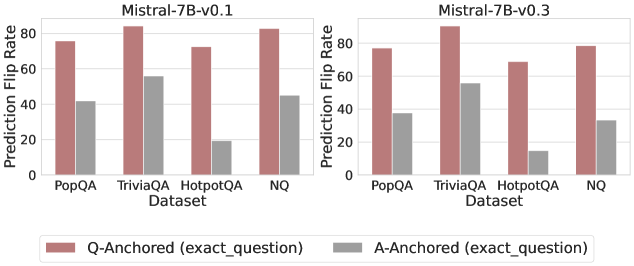
The image contains two side-by-side bar charts comparing prediction flip rates for two versions of the Mistral-7B language model (v0.1 and v0.3) across four question-answering datasets: PopQA, TriviaQA, HotpotQA, and NQ. Each dataset is evaluated using two anchoring methods: **Q-Anchored (exact_question)** (red bars) and **A-Anchored (exact_question)** (gray bars). The y-axis represents prediction flip rate (0–80%), and the x-axis lists datasets.
---
### Components/Axes
- **X-Axis (Datasets)**: PopQA, TriviaQA, HotpotQA, NQ (left to right).
- **Y-Axis (Prediction Flip Rate)**: Scaled from 0 to 80% in increments of 20.
- **Legend**: Located at the bottom of both charts. Red = Q-Anchored (exact_question), Gray = A-Anchored (exact_question).
- **Chart Titles**:
- Left chart: "Mistral-7B-v0.1"
- Right chart: "Mistral-7B-v0.3"
---
### Detailed Analysis
#### Mistral-7B-v0.1 (Left Chart)
- **Q-Anchored (red)**:
- PopQA: ~75%
- TriviaQA: ~82%
- HotpotQA: ~72%
- NQ: ~81%
- **A-Anchored (gray)**:
- PopQA: ~40%
- TriviaQA: ~55%
- HotpotQA: ~18%
- NQ: ~45%
#### Mistral-7B-v0.3 (Right Chart)
- **Q-Anchored (red)**:
- PopQA: ~76%
- TriviaQA: ~85%
- HotpotQA: ~65%
- NQ: ~77%
- **A-Anchored (gray)**:
- PopQA: ~35%
- TriviaQA: ~52%
- HotpotQA: ~12%
- NQ: ~32%
---
### Key Observations
1. **Q-Anchored Consistently Outperforms A-Anchored**:
- Across all datasets and models, Q-Anchored rates are significantly higher than A-Anchored (e.g., TriviaQA v0.1: 82% vs. 55%).
2. **HotpotQA Anomaly**:
- A-Anchored performance drops sharply in v0.3 (18% → 12%), while Q-Anchored also declines (72% → 65%).
3. **TriviaQA Dominance**:
- TriviaQA shows the highest Q-Anchored rates for both models (82% and 85%).
4. **NQ Dataset**:
- NQ has the lowest A-Anchored rates (45% and 32%) but remains the second-highest for Q-Anchored in v0.1.
---
### Interpretation
- **Effectiveness of Q-Anchoring**: The consistent superiority of Q-Anchored suggests that grounding predictions on the exact question text improves accuracy, likely by reducing ambiguity.
- **Model Version Impact**:
- v0.3 shows reduced performance in HotpotQA for both anchoring methods, possibly due to architectural changes or dataset-specific biases.
- A-Anchored degradation in HotpotQA (v0.3) may indicate overfitting or misalignment with the dataset’s structure.
- **Dataset Sensitivity**: TriviaQA’s high performance implies it aligns well with the model’s training data or prompting strategy, while HotpotQA’s volatility suggests sensitivity to model updates.
---
### Spatial Grounding & Verification
- **Legend Position**: Bottom center, clearly associating colors with anchoring methods.
- **Bar Alignment**: Red (Q-Anchored) bars are consistently taller than gray (A-Anchored) bars across all datasets and models.
- **Trend Verification**:
- Q-Anchored trends upward for TriviaQA and NQ in v0.3, while HotpotQA trends downward.
- A-Anchored rates decline for HotpotQA in v0.3, confirming model version impact.
---
### Conclusion
The data demonstrates that Q-Anchored (exact_question) significantly enhances prediction reliability compared to A-Anchored methods. The decline in HotpotQA performance in v0.3 warrants further investigation into dataset-model compatibility. TriviaQA’s consistent high performance highlights its suitability for evaluating question-answering systems.