# Chart Analysis: Accuracy vs. Frequency by Retrieval Threshold
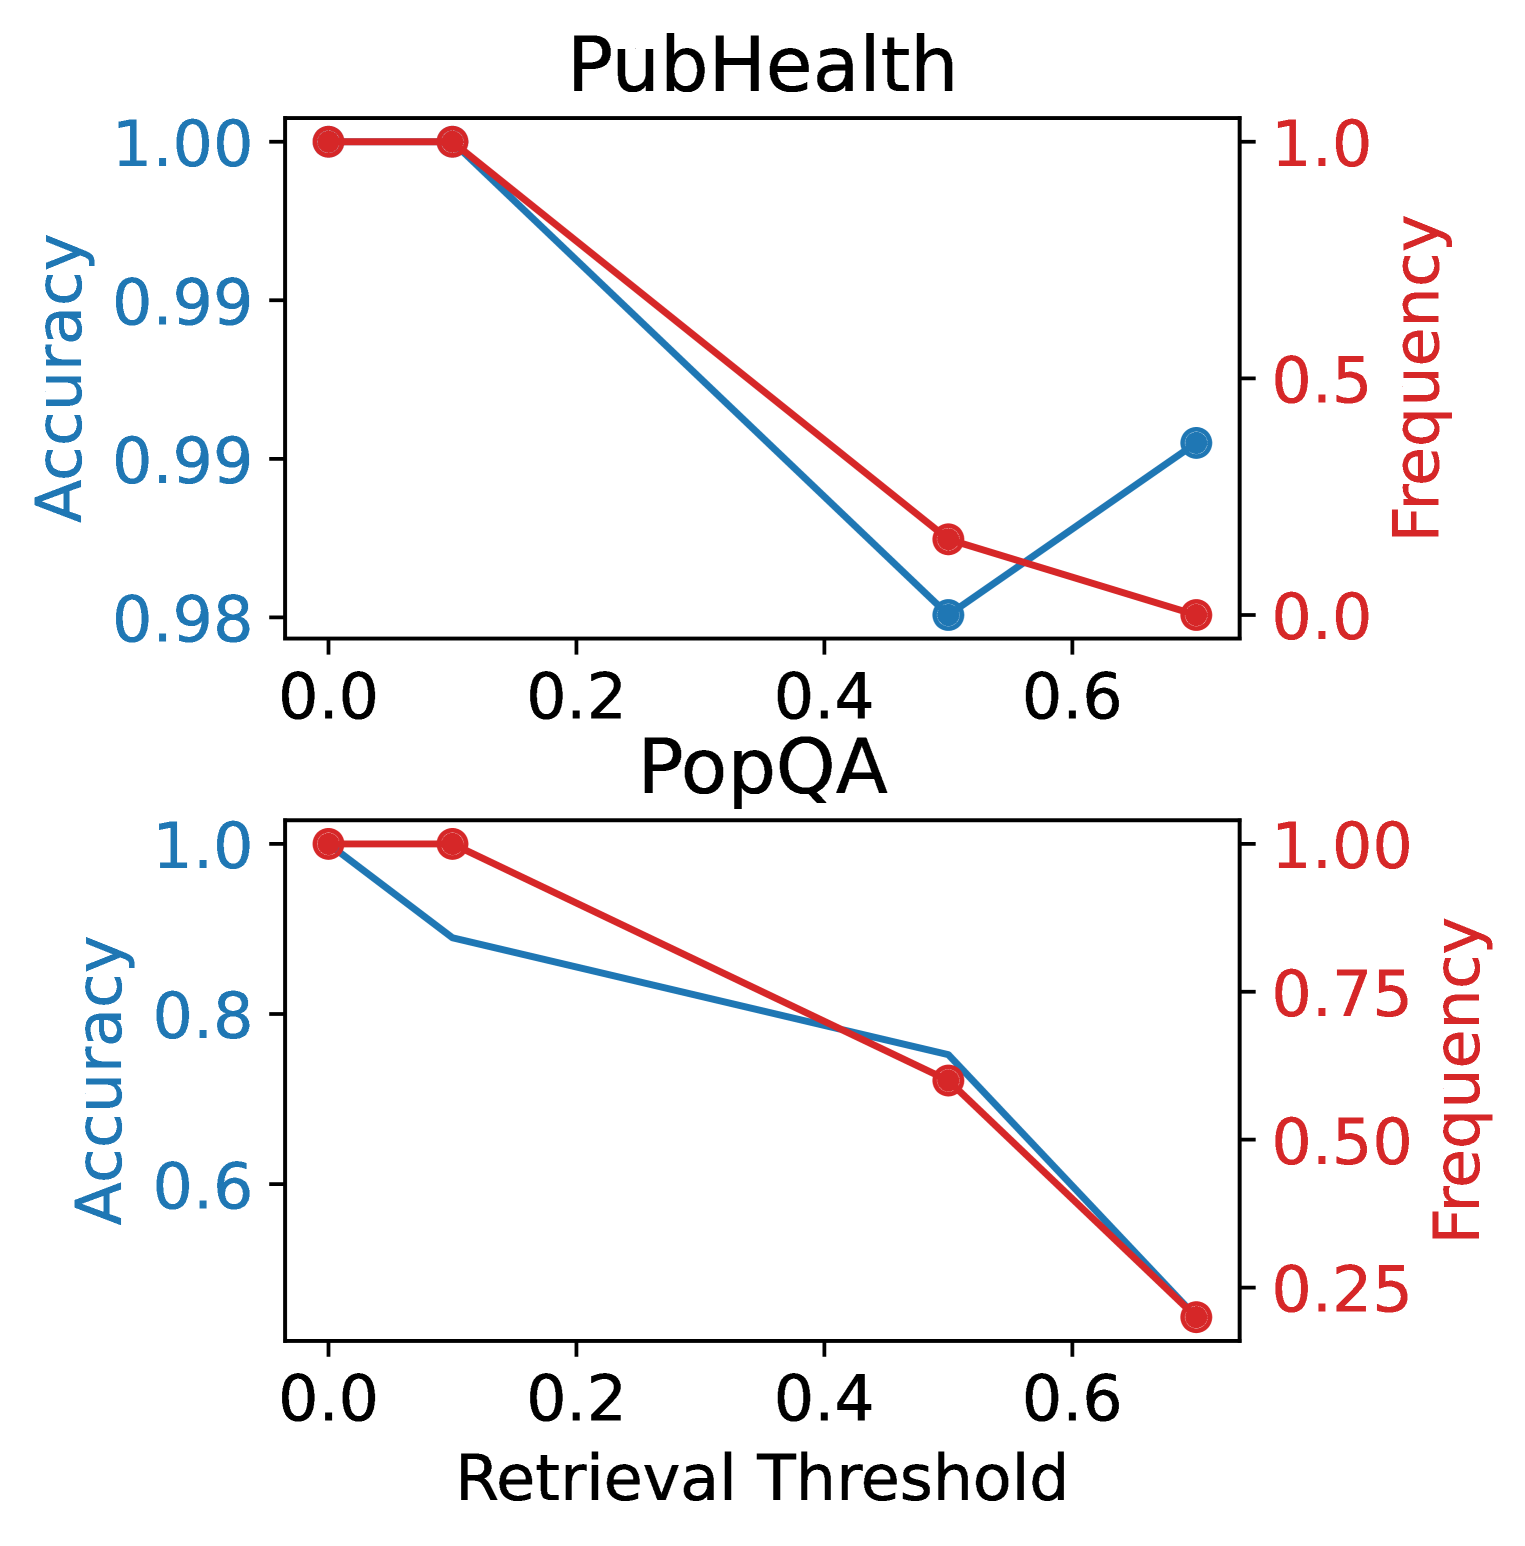
## Chart 1: PubHealth
- **Title**: PubHealth
- **X-axis**: Retrieval Threshold (0.0, 0.2, 0.4, 0.6)
- **Y-axis (Left)**: Accuracy (0.98, 0.99, 1.00)
- **Y-axis (Right)**: Frequency (0.0, 0.5, 1.0)
- **Lines**:
- **Blue (Accuracy)**:
- Starts at (0.0, 1.00)
- Drops to (0.6, 0.98)
- **Red (Frequency)**:
- Starts at (0.0, 1.00)
- Drops to (0.6, 0.0)
- **Key Trends**:
- Accuracy decreases linearly with increasing retrieval threshold.
- Frequency decreases linearly with increasing retrieval threshold.
## Chart 2: PopQA
- **Title**: PopQA
- **X-axis**: Retrieval Threshold (0.0, 0.2, 0.4, 0.6)
- **Y-axis (Left)**: Accuracy (0.6, 0.8, 1.0)
- **Y-axis (Right)**: Frequency (0.25, 0.5, 0.75, 1.0)
- **Lines**:
- **Blue (Accuracy)**:
- Starts at (0.0, 1.00)
- Drops to (0.6, 0.6)
- **Red (Frequency)**:
- Starts at (0.0, 1.00)
- Drops to (0.6, 0.25)
- **Key Trends**:
- Accuracy decreases linearly with increasing retrieval threshold.
- Frequency decreases linearly with increasing retrieval threshold.
## Legend
- **Accuracy**: Blue line
- **Frequency**: Red line
## Cross-Reference Validation
- Both charts confirm:
- Blue line (Accuracy) corresponds to left Y-axis values.
- Red line (Frequency) corresponds to right Y-axis values.
- Inverse relationship between Accuracy and Frequency in both datasets.