## Line Charts: Validation Loss vs. Tokens Seen for Different Training Strategies
### Overview
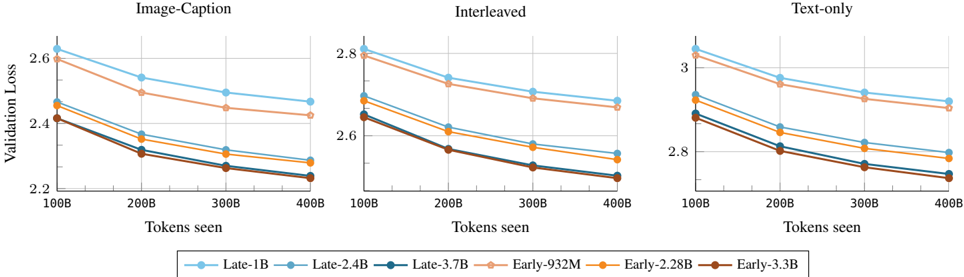
The image presents three line charts comparing the validation loss of different language models as a function of the number of tokens seen during training. The charts are grouped by training strategy: "Image-Caption", "Interleaved", and "Text-only". Each chart displays the performance of six different model configurations, distinguished by color-coded lines. The x-axis represents the number of tokens seen (in billions), and the y-axis represents the validation loss.
### Components/Axes
* **Titles:**
* Top-left chart: "Image-Caption"
* Top-middle chart: "Interleaved"
* Top-right chart: "Text-only"
* **X-axis:** "Tokens seen" with markers at 100B, 200B, 300B, and 400B.
* **Y-axis:** "Validation Loss" with markers ranging from 2.2 to 2.6 for "Image-Caption", 2.6 to 2.8 for "Interleaved", and 2.8 to 3.0 for "Text-only".
* **Legend:** Located at the bottom of the image.
* Light Blue: "Late-1B"
* Tan: "Late-2.4B"
* Dark Blue: "Late-3.7B"
* Light Orange: "Early-932M"
* Orange: "Early-2.28B"
* Brown: "Early-3.3B"
### Detailed Analysis
**Chart 1: Image-Caption**
* **Late-1B (Light Blue):** Starts at approximately 2.62 and decreases to approximately 2.45.
* **Late-2.4B (Tan):** Starts at approximately 2.48 and decreases to approximately 2.30.
* **Late-3.7B (Dark Blue):** Starts at approximately 2.42 and decreases to approximately 2.26.
* **Early-932M (Light Orange):** Starts at approximately 2.45 and decreases to approximately 2.28.
* **Early-2.28B (Orange):** Starts at approximately 2.38 and decreases to approximately 2.25.
* **Early-3.3B (Brown):** Starts at approximately 2.40 and decreases to approximately 2.24.
**Chart 2: Interleaved**
* **Late-1B (Light Blue):** Starts at approximately 2.82 and decreases to approximately 2.70.
* **Late-2.4B (Tan):** Starts at approximately 2.72 and decreases to approximately 2.60.
* **Late-3.7B (Dark Blue):** Starts at approximately 2.65 and decreases to approximately 2.55.
* **Early-932M (Light Orange):** Starts at approximately 2.70 and decreases to approximately 2.60.
* **Early-2.28B (Orange):** Starts at approximately 2.68 and decreases to approximately 2.58.
* **Early-3.3B (Brown):** Starts at approximately 2.65 and decreases to approximately 2.53.
**Chart 3: Text-only**
* **Late-1B (Light Blue):** Starts at approximately 3.05 and decreases to approximately 2.90.
* **Late-2.4B (Tan):** Starts at approximately 2.95 and decreases to approximately 2.80.
* **Late-3.7B (Dark Blue):** Starts at approximately 2.90 and decreases to approximately 2.75.
* **Early-932M (Light Orange):** Starts at approximately 2.92 and decreases to approximately 2.78.
* **Early-2.28B (Orange):** Starts at approximately 2.88 and decreases to approximately 2.75.
* **Early-3.3B (Brown):** Starts at approximately 2.85 and decreases to approximately 2.73.
### Key Observations
* In all three charts, the validation loss decreases as the number of tokens seen increases. This indicates that the models are learning as they are exposed to more data.
* The "Late-1B" model consistently has the highest validation loss across all three training strategies.
* The "Early-3.3B" model generally has the lowest validation loss, indicating better performance.
* The "Text-only" training strategy results in the highest validation loss values compared to "Image-Caption" and "Interleaved".
* The "Image-Caption" training strategy results in the lowest validation loss values compared to "Interleaved" and "Text-only".
### Interpretation
The data suggests that the "Early-3.3B" model configuration is the most effective in terms of minimizing validation loss, regardless of the training strategy used. The "Text-only" training strategy appears to be the least effective, possibly indicating that incorporating image data (as in "Image-Caption" and "Interleaved") improves model performance. The consistent decrease in validation loss with increasing tokens seen confirms the expected learning behavior of the models. The differences in performance between the "Early" and "Late" models, as well as the impact of different training strategies, highlight the importance of model architecture and training data composition in achieving optimal results.