\n
## Line Chart: Validation Loss vs. Tokens Seen for Different Models
### Overview
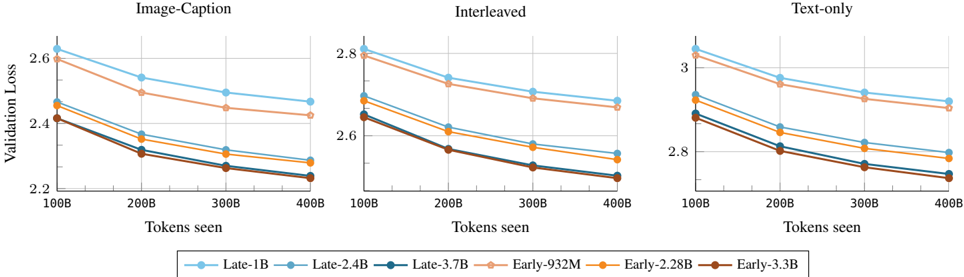
The image presents three line charts, each depicting the relationship between Validation Loss and Tokens Seen for different model configurations. The charts are arranged horizontally, representing three different training data modalities: Image-Caption, Interleaved, and Text-only. Each chart displays six distinct lines, each representing a different model (Late-1B, Late-2.4B, Late-3.7B, Early-932M, Early-2.28B, Early-3.3B). The charts aim to compare the performance of these models across different training data types as measured by validation loss during training.
### Components/Axes
* **X-axis:** "Tokens seen", ranging from 100B to 400B, with markers at 100B, 200B, 300B, and 400B.
* **Y-axis:** "Validation Loss", with varying scales for each chart:
* Image-Caption: 2.2 to 2.9
* Interleaved: 2.5 to 2.9
* Text-only: 2.7 to 3.1
* **Legend:** Located at the bottom-center of the image, identifying each line with a model name and color.
* Late-1B (Light Blue)
* Late-2.4B (Blue)
* Late-3.7B (Dark Blue)
* Early-932M (Light Orange)
* Early-2.28B (Orange)
* Early-3.3B (Dark Orange)
* **Titles:** Each chart has a title indicating the training data modality: "Image-Caption", "Interleaved", and "Text-only".
### Detailed Analysis or Content Details
**Image-Caption Chart:**
* **Late-1B (Light Blue):** Starts at approximately 2.85, decreases to approximately 2.35.
* **Late-2.4B (Blue):** Starts at approximately 2.75, decreases to approximately 2.3.
* **Late-3.7B (Dark Blue):** Starts at approximately 2.7, decreases to approximately 2.25.
* **Early-932M (Light Orange):** Starts at approximately 2.65, decreases to approximately 2.4.
* **Early-2.28B (Orange):** Starts at approximately 2.55, decreases to approximately 2.35.
* **Early-3.3B (Dark Orange):** Starts at approximately 2.5, decreases to approximately 2.3.
**Interleaved Chart:**
* **Late-1B (Light Blue):** Starts at approximately 2.85, decreases to approximately 2.55.
* **Late-2.4B (Blue):** Starts at approximately 2.8, decreases to approximately 2.5.
* **Late-3.7B (Dark Blue):** Starts at approximately 2.75, decreases to approximately 2.45.
* **Early-932M (Light Orange):** Starts at approximately 2.7, decreases to approximately 2.5.
* **Early-2.28B (Orange):** Starts at approximately 2.65, decreases to approximately 2.4.
* **Early-3.3B (Dark Orange):** Starts at approximately 2.6, decreases to approximately 2.35.
**Text-only Chart:**
* **Late-1B (Light Blue):** Starts at approximately 3.05, decreases to approximately 2.8.
* **Late-2.4B (Blue):** Starts at approximately 3.0, decreases to approximately 2.75.
* **Late-3.7B (Dark Blue):** Starts at approximately 2.95, decreases to approximately 2.7.
* **Early-932M (Light Orange):** Starts at approximately 2.9, decreases to approximately 2.7.
* **Early-2.28B (Orange):** Starts at approximately 2.85, decreases to approximately 2.65.
* **Early-3.3B (Dark Orange):** Starts at approximately 2.8, decreases to approximately 2.6.
### Key Observations
* In all three charts, the validation loss generally decreases as the number of tokens seen increases, indicating that the models are learning and improving with more training data.
* The "Late" models consistently exhibit lower validation loss compared to the "Early" models for the same number of tokens seen across all three data modalities.
* The largest models (Late-3.7B and Early-3.3B) generally achieve the lowest validation loss, suggesting that model size is a significant factor in performance.
* The rate of decrease in validation loss appears to slow down as the number of tokens seen increases, indicating diminishing returns from further training.
* The Text-only chart has the highest overall validation loss values compared to the Image-Caption and Interleaved charts, suggesting that this data modality is more challenging for the models.
### Interpretation
The data suggests that model performance, as measured by validation loss, is influenced by both model size and the type of training data used. Larger models generally perform better, and the choice of data modality can significantly impact the learning process. The consistent decrease in validation loss across all models indicates that continued training is beneficial, but the diminishing returns suggest that there is a point at which further training may not yield substantial improvements. The higher validation loss observed in the Text-only modality could be due to the inherent complexity of language modeling or the specific characteristics of the text dataset used. The comparison between "Early" and "Late" models suggests that the training procedure or initialization strategy used for the "Late" models is more effective. These charts provide valuable insights into the training dynamics of these models and can inform decisions about model selection, training data curation, and hyperparameter tuning.