## Line Charts: Validation Loss vs. Tokens Seen for Different Model Architectures
### Overview
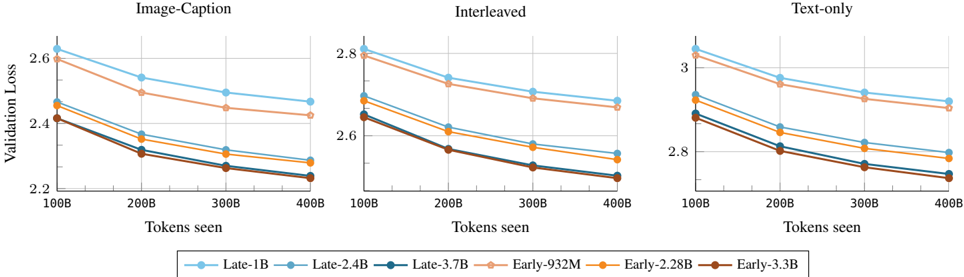
The image displays three line charts arranged horizontally, comparing the validation loss of six different model variants as a function of the number of training tokens seen. The charts are segmented by data modality or training setup: "Image-Caption", "Interleaved", and "Text-only". All charts show a consistent downward trend, indicating that validation loss decreases as more training tokens are processed.
### Components/Axes
* **Chart Headers (Top Center of each subplot):**
* Left Chart: `Image-Caption`
* Middle Chart: `Interleaved`
* Right Chart: `Text-only`
* **X-Axis (Common to all charts):**
* Label: `Tokens seen`
* Scale: Linear, with major tick marks at `100B`, `200B`, `300B`, and `400B`.
* **Y-Axis (Common label, different scales):**
* Label: `Validation Loss` (rotated vertically on the left side of the first chart).
* Scale (Left Chart - Image-Caption): Ranges from approximately 2.2 to 2.7.
* Scale (Middle Chart - Interleaved): Ranges from approximately 2.5 to 2.9.
* Scale (Right Chart - Text-only): Ranges from approximately 2.7 to 3.1.
* **Legend (Bottom Center, spanning all charts):**
* A horizontal legend identifies six model variants by color and marker:
1. `Late-1B`: Light blue line with circle markers.
2. `Late-2.4B`: Medium blue line with circle markers.
3. `Late-3.7B`: Dark blue line with circle markers.
4. `Early-932M`: Light orange line with circle markers.
5. `Early-2.28B`: Medium orange line with circle markers.
6. `Early-3.3B`: Dark orange/brown line with circle markers.
### Detailed Analysis
**General Trend:** For all models and across all three tasks, validation loss decreases monotonically as the number of tokens seen increases from 100B to 400B. The rate of decrease (slope) is steepest between 100B and 200B tokens and gradually flattens, suggesting diminishing returns.
**Model Performance Hierarchy (Consistent across all charts):**
1. **Best (Lowest Loss):** `Late-3.7B` (Dark blue).
2. **Second Best:** `Late-2.4B` (Medium blue).
3. **Third Best:** `Late-1B` (Light blue).
4. **Fourth Best:** `Early-3.3B` (Dark orange/brown).
5. **Fifth Best:** `Early-2.28B` (Medium orange).
6. **Worst (Highest Loss):** `Early-932M` (Light orange).
**Key Data Points (Approximate Values):**
* **Left Chart: Image-Caption**
* `Late-3.7B`: Starts at ~2.42 (100B), ends at ~2.22 (400B).
* `Early-932M`: Starts at ~2.62 (100B), ends at ~2.48 (400B).
* The gap between the best (`Late-3.7B`) and worst (`Early-932M`) model narrows slightly from ~0.20 to ~0.26.
* **Middle Chart: Interleaved**
* `Late-3.7B`: Starts at ~2.64 (100B), ends at ~2.48 (400B).
* `Early-932M`: Starts at ~2.80 (100B), ends at ~2.68 (400B).
* The overall loss values are higher than the Image-Caption task.
* **Right Chart: Text-only**
* `Late-3.7B`: Starts at ~2.88 (100B), ends at ~2.72 (400B).
* `Early-932M`: Starts at ~3.04 (100B), ends at ~2.92 (400B).
* This task shows the highest absolute loss values of the three.
### Key Observations
1. **Architecture Superiority:** The "Late" model family (blue lines) consistently and significantly outperforms the "Early" model family (orange lines) of comparable or even larger size. For example, the `Late-1B` model has lower loss than the `Early-3.3B` model in all charts.
2. **Scale Benefit:** Within each family ("Late" or "Early"), larger models (more parameters) achieve lower validation loss. The performance order strictly follows model size.
3. **Task Difficulty:** The absolute validation loss values suggest a hierarchy of task difficulty for these models: `Text-only` (hardest) > `Interleaved` > `Image-Caption` (easiest).
4. **Convergence:** All models are still on a downward trajectory at 400B tokens, indicating they have not fully converged and could potentially improve with further training.
### Interpretation
This data strongly suggests that the "Late" model architecture is more data-efficient and achieves better performance than the "Early" architecture for these multimodal and text-only tasks. The consistent ranking across all three data modalities indicates the architectural advantage is robust and not specific to a single type of input.
The relationship between model size and performance is as expected: larger models have greater capacity and thus lower loss. However, the architectural difference appears to be a more significant factor than a moderate increase in size, as seen by the `Late-1B` outperforming the `Early-3.3B`.
The variation in loss across tasks implies that integrating visual information (Image-Caption, Interleaved) might provide a stronger learning signal or an easier optimization landscape compared to pure text for these specific models and training regimes. The "Interleaved" task, which likely mixes image and text tokens, shows intermediate difficulty.
The lack of plateau in the curves suggests that the models are still learning effectively at 400B tokens. A practitioner would infer that extending training further could yield additional gains, and that choosing the "Late" architecture is crucial for optimal results. The clear, stratified results make this a compelling visual argument for the superiority of one architectural approach over another.