# Technical Data Extraction: Model Performance Comparison
This document contains a detailed extraction of data from two bar charts comparing the performance of two Large Language Models (LLMs), **Qwen3 32B** and **Gemma3 12B**, based on task accuracy relative to "Turn Complexity."
---
## 1. Chart Overview and Global Metadata
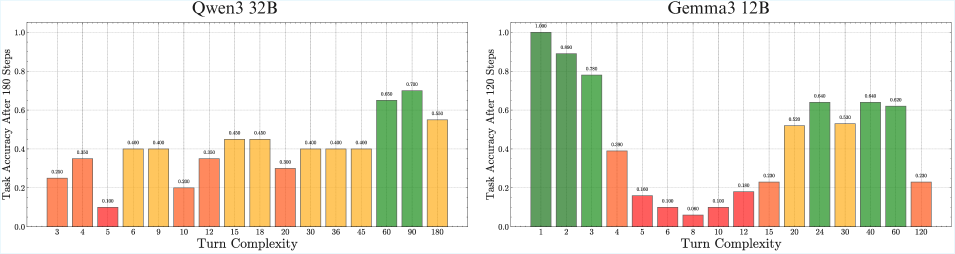
The image consists of two side-by-side bar charts. Both charts share a similar structure:
* **Y-Axis:** "Task Accuracy After [N] Steps" (Scale: 0.0 to 1.0).
* **X-Axis:** "Turn Complexity" (Categorical values representing steps or complexity levels).
* **Color Coding (Performance Tiers):**
* **Green:** High Accuracy (typically $\ge 0.60$).
* **Yellow/Orange:** Medium Accuracy (typically $0.40$ to $0.59$).
* **Red/Coral:** Low Accuracy (typically $< 0.40$).
---
## 2. Left Chart: Qwen3 32B
**Header:** Qwen3 32B
**Y-Axis Label:** Task Accuracy After 180 Steps
**Trend Analysis:** The model shows inconsistent performance at low complexity (3-12), stabilizes at a moderate level for mid-range complexity (15-45), and peaks at high complexity (60-90) before dropping slightly at the maximum complexity of 180.
### Data Table: Qwen3 32B
| Turn Complexity (X) | Task Accuracy (Y) | Color Category |
| :--- | :--- | :--- |
| 3 | 0.250 | Red/Coral |
| 4 | 0.350 | Red/Coral |
| 5 | 0.100 | Red |
| 6 | 0.400 | Yellow |
| 9 | 0.400 | Yellow |
| 10 | 0.200 | Red/Coral |
| 12 | 0.350 | Red/Coral |
| 15 | 0.450 | Yellow |
| 18 | 0.450 | Yellow |
| 20 | 0.300 | Red/Coral |
| 30 | 0.400 | Yellow |
| 36 | 0.400 | Yellow |
| 45 | 0.400 | Yellow |
| 60 | 0.650 | Green |
| 90 | 0.700 | Green |
| 180 | 0.550 | Yellow |
---
## 3. Right Chart: Gemma3 12B
**Header:** Gemma3 12B
**Y-Axis Label:** Task Accuracy After 120 Steps
**Trend Analysis:** This model exhibits a "U-shaped" or "Bimodal" distribution. It starts with perfect/near-perfect accuracy at very low complexity (1-3), suffers a significant "trough" or performance collapse in the mid-range (5-12), recovers significantly at higher complexities (24-60), and then drops sharply at the final complexity level (120).
### Data Table: Gemma3 12B
| Turn Complexity (X) | Task Accuracy (Y) | Color Category |
| :--- | :--- | :--- |
| 1 | 1.000 | Green |
| 2 | 0.890 | Green |
| 3 | 0.780 | Green |
| 4 | 0.390 | Red/Coral |
| 5 | 0.160 | Red |
| 6 | 0.100 | Red |
| 8 | 0.060 | Red |
| 10 | 0.100 | Red |
| 12 | 0.180 | Red |
| 15 | 0.230 | Red/Coral |
| 20 | 0.520 | Yellow |
| 24 | 0.640 | Green |
| 30 | 0.530 | Yellow |
| 40 | 0.640 | Green |
| 60 | 0.620 | Green |
| 120 | 0.230 | Red/Coral |
---
## 4. Comparative Summary
* **Peak Performance:** Gemma3 12B achieves a higher absolute peak (1.000 at complexity 1) compared to Qwen3 32B (0.700 at complexity 90).
* **Stability:** Qwen3 32B maintains a more consistent, albeit lower, baseline across the mid-range complexities.
* **Failure Points:** Gemma3 12B shows a critical failure zone between complexity 5 and 12, where accuracy drops below 0.200. Qwen3 32B's lowest point is 0.100 at complexity 5, but it recovers much faster.
* **High Complexity Handling:** Both models show a performance decline at their respective maximum complexity limits (180 for Qwen3, 120 for Gemma3).