# Technical Document Extraction: Conductance vs. Twisting Angle Analysis
## General Observations
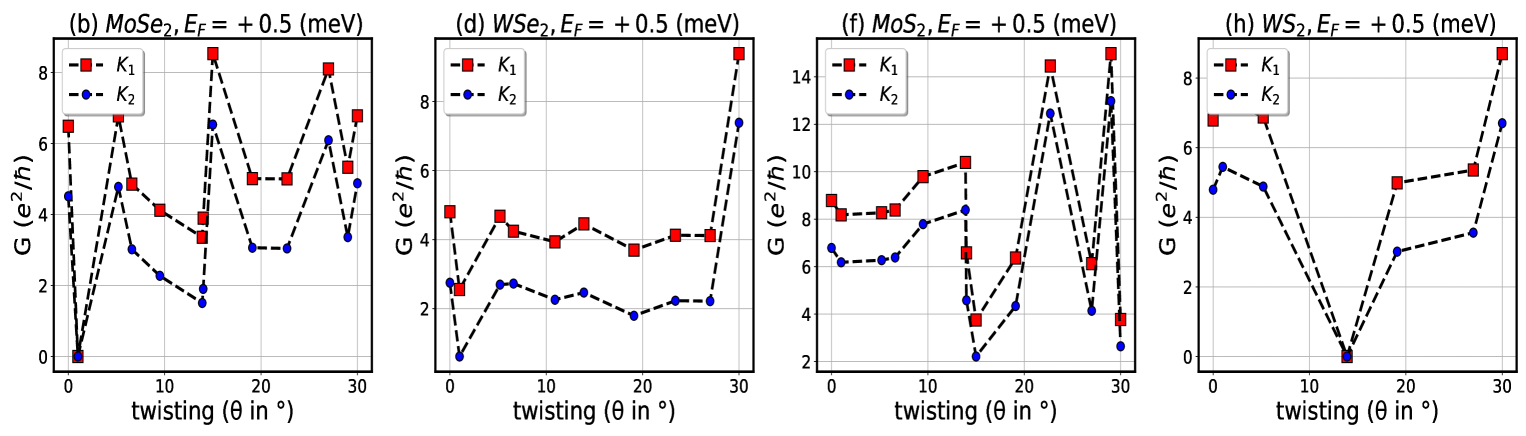
- **Graphs (b)-(h)** depict conductance (G) as a function of twisting angle (θ) for different 2D materials.
- **EF = +0.5 meV** is constant across all graphs.
- **Legend**:
- **K₁** (red squares) and **K₂** (blue circles) represent distinct conductance pathways or states.
- Dashed lines connect data points for clarity.
---
### Graph (b): MoSe₂
- **X-axis**: Twisting angle (θ) in degrees (0–30°).
- **Y-axis**: Conductance (G) in units of e²/h.
- **Key Trends**:
- **K₁** (red):
- Sharp peak at θ = 5° (G ≈ 8 e²/h).
- Secondary peaks at θ ≈ 15° and 25° (G ≈ 6–7 e²/h).
- **K₂** (blue):
- Peaks at θ = 5° (G ≈ 4 e²/h) and θ = 25° (G ≈ 6 e²/h).
- Minima at θ ≈ 10° and 20° (G ≈ 2 e²/h).
---
### Graph (d): WSe₂
- **X-axis**: Twisting angle (θ) in degrees (0–30°).
- **Y-axis**: Conductance (G) in units of e²/h.
- **Key Trends**:
- **K₁** (red):
- Peaks at θ = 5° (G ≈ 5 e²/h) and θ = 30° (G ≈ 9 e²/h).
- Relatively flat between 10°–20° (G ≈ 4 e²/h).
- **K₂** (blue):
- Peaks at θ = 5° (G ≈ 3 e²/h) and θ = 30° (G ≈ 7.5 e²/h).
- Minima at θ ≈ 15° (G ≈ 2 e²/h).
---
### Graph (f): MoS₂
- **X-axis**: Twisting angle (θ) in degrees (0–30°).
- **Y-axis**: Conductance (G) in units of e²/h.
- **Key Trends**:
- **K₁** (red):
- Peaks at θ = 25° (G ≈ 14 e²/h) and θ = 30° (G ≈ 15 e²/h).
- Moderate values at θ = 0°–10° (G ≈ 8–10 e²/h).
- **K₂** (blue):
- Peaks at θ = 25° (G ≈ 12.5 e²/h) and θ = 30° (G ≈ 13.5 e²/h).
- Sharp drop at θ = 15° (G ≈ 2 e²/h).
---
### Graph (h): WS₂
- **X-axis**: Twisting angle (θ) in degrees (0–30°).
- **Y-axis**: Conductance (G) in units of e²/h.
- **Key Trends**:
- **K₁** (red):
- Peaks at θ = 5° (G ≈ 7 e²/h) and θ = 30° (G ≈ 9 e²/h).
- Relatively flat between 10°–20° (G ≈ 5 e²/h).
- **K₂** (blue):
- Peaks at θ = 5° (G ≈ 5.5 e²/h) and θ = 30° (G ≈ 6.5 e²/h).
- Minima at θ ≈ 15° (G ≈ 0.5 e²/h).
---
## Cross-Graph Comparisons
1. **Peak Conductance**:
- **K₁** consistently exhibits higher conductance than **K₂** across all materials.
- **MoS₂** (graph f) shows the highest peak for **K₁** (15 e²/h at θ = 30°).
2. **Twisting Sensitivity**:
- **MoSe₂** and **WS₂** (graphs b, h) show pronounced conductance oscillations with twisting.
- **WSe₂** (graph d) exhibits less variability, with **K₁** remaining relatively stable.
3. **Material-Specific Behavior**:
- **MoS₂** and **WS₂** demonstrate sharper peaks at higher twisting angles (25°–30°).
- **MoSe₂** and **WSe₂** show more distributed peaks across the twisting range.
---
## Critical Notes
- **Legend Consistency**: Red squares (**K₁**) and blue circles (**K₂**) are uniformly applied across all graphs.
- **Axis Labels**: All graphs share identical axis titles ("twisting (θ in °)" and "G (e²/h)").
- **EF Uniformity**: The fixed EF value (+0.5 meV) suggests a controlled experimental condition for comparative analysis.