## Stacked Bar Chart: R1-Qwen | MATH500
### Overview
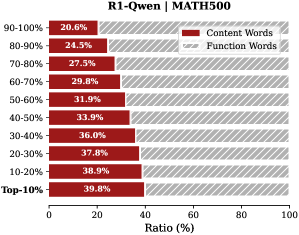
The image is a stacked bar chart comparing the ratio of "Content Words" and "Function Words" across different performance percentiles (Top-10% to 90-100%) in the context of "R1-Qwen | MATH500". The x-axis represents the ratio in percentage, and the y-axis represents the performance percentile.
### Components/Axes
* **Title:** R1-Qwen | MATH500
* **X-axis:** Ratio (%) - Ranges from 0 to 100.
* **Y-axis:** Performance Percentiles - Categories are: Top-10%, 10-20%, 20-30%, 30-40%, 40-50%, 50-60%, 60-70%, 70-80%, 80-90%, 90-100%.
* **Legend:** Located at the top-right of the chart.
* Content Words (Dark Red)
* Function Words (Light Gray with diagonal lines)
### Detailed Analysis
The chart displays the ratio of content words and function words for different performance percentiles. The "Content Words" are represented by dark red bars, and "Function Words" are represented by light gray bars with diagonal lines. The bars are stacked, so the total length of each bar represents 100%.
Here's a breakdown of the data for each percentile:
* **Top-10%:** Content Words: 39.8%, Function Words: approximately 60.2%
* **10-20%:** Content Words: 38.9%, Function Words: approximately 61.1%
* **20-30%:** Content Words: 37.8%, Function Words: approximately 62.2%
* **30-40%:** Content Words: 36.0%, Function Words: approximately 64.0%
* **40-50%:** Content Words: 33.9%, Function Words: approximately 66.1%
* **50-60%:** Content Words: 31.9%, Function Words: approximately 68.1%
* **60-70%:** Content Words: 29.8%, Function Words: approximately 70.2%
* **70-80%:** Content Words: 27.5%, Function Words: approximately 72.5%
* **80-90%:** Content Words: 24.5%, Function Words: approximately 75.5%
* **90-100%:** Content Words: 20.6%, Function Words: approximately 79.4%
**Trends:**
* The ratio of "Content Words" generally decreases as the performance percentile decreases (from Top-10% to 90-100%).
* Conversely, the ratio of "Function Words" generally increases as the performance percentile decreases.
### Key Observations
* The "Top-10%" percentile has the highest ratio of "Content Words" (39.8%).
* The "90-100%" percentile has the lowest ratio of "Content Words" (20.6%).
* The difference in "Content Words" ratio between the "Top-10%" and "90-100%" percentiles is significant (39.8% vs 20.6%).
### Interpretation
The data suggests that higher-performing models (Top-10%) tend to use a higher proportion of "Content Words" compared to lower-performing models (90-100%). This could indicate that better models are more focused on the core content and meaning, while lower-performing models rely more on function words (e.g., prepositions, articles, conjunctions) which may contribute less to the semantic content. The trend highlights a potential correlation between the type of words used and the overall performance of the model in the MATH500 task. It is important to note that this is just one aspect of model performance, and other factors also play a significant role.