## Line Chart: Query Budget vs. User Position
### Overview
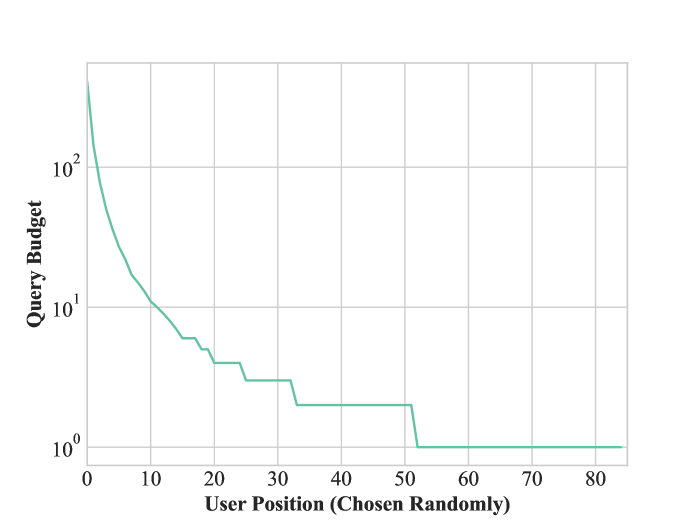
The image is a line chart showing the relationship between "Query Budget" (y-axis) and "User Position (Chosen Randomly)" (x-axis). The y-axis is on a logarithmic scale. The chart illustrates how the query budget decreases as the user position increases.
### Components/Axes
* **X-axis:** "User Position (Chosen Randomly)". The axis ranges from 0 to 80, with tick marks at intervals of 10.
* **Y-axis:** "Query Budget". The axis is on a log scale, ranging from 10^0 (1) to 10^2 (100).
* **Data Series:** A single line in a light teal color represents the query budget.
### Detailed Analysis
* **Trend:** The teal line shows a decreasing trend. The query budget decreases rapidly for lower user positions (0-10) and then decreases more gradually, with step-like drops, as the user position increases. After a user position of approximately 50, the query budget remains constant at approximately 1.
* **Data Points (Approximate):**
* User Position 0: Query Budget ~150
* User Position 10: Query Budget ~10
* User Position 20: Query Budget ~6
* User Position 30: Query Budget ~3
* User Position 40: Query Budget ~2
* User Position 50: Query Budget ~1
* User Position 60: Query Budget ~1
* User Position 70: Query Budget ~1
* User Position 80: Query Budget ~1
### Key Observations
* The query budget is highest for users in the initial positions and decreases significantly as the user position increases.
* The rate of decrease in the query budget slows down as the user position increases.
* After a user position of approximately 50, the query budget plateaus at a value of approximately 1.
### Interpretation
The chart suggests that the query budget allocated to users decreases as their position (presumably in a ranking or list) increases. This could be due to a strategy where more resources are allocated to users who are more likely to be relevant or valuable. The plateau at a user position of 50 indicates a minimum query budget that is allocated to all users beyond that position. The logarithmic scale on the y-axis emphasizes the rapid initial decrease in query budget.