## Line Chart: Query Budget vs. User Position
### Overview
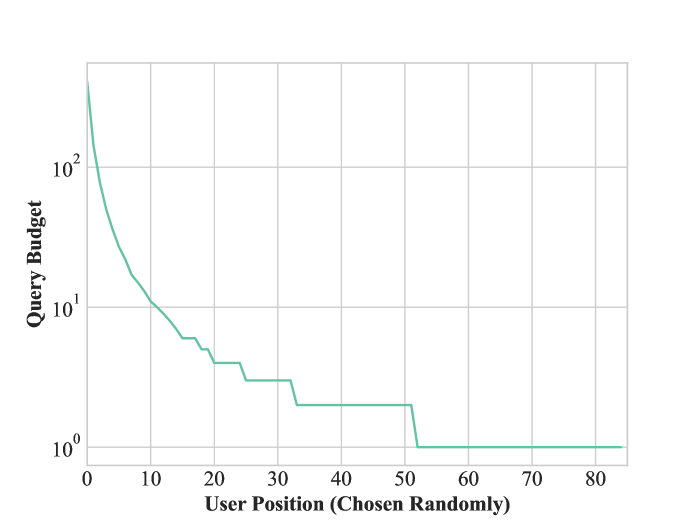
This image displays a line chart illustrating the relationship between "Query Budget" and "User Position (Chosen Randomly)". The chart uses a logarithmic scale for the y-axis, indicating that the query budget decreases significantly as the user position increases.
### Components/Axes
* **Y-axis Title:** "Query Budget"
* **Scale:** Logarithmic, with major tick marks at 10⁰ (1), 10¹ (10), and 10² (100).
* **Axis Markers:** 10⁰, 10¹, 10².
* **X-axis Title:** "User Position (Chosen Randomly)"
* **Scale:** Linear.
* **Axis Markers:** 0, 10, 20, 30, 40, 50, 60, 70, 80.
* **Data Series:** A single line, colored in a light teal/cyan hue.
* **Legend:** There is no explicit legend, but the single data series is visually represented by the light teal/cyan line.
### Detailed Analysis
The chart shows a steep initial decline in Query Budget as User Position increases from 0.
* **At User Position 0:** The Query Budget is approximately 100 (10²).
* **Between User Position 0 and 10:** The Query Budget drops sharply, reaching approximately 10 (10¹) at User Position 10.
* **Between User Position 10 and 20:** The Query Budget continues to decrease, with several small steps, reaching approximately 5 at User Position 20.
* **Between User Position 20 and 30:** The Query Budget shows a stepped decrease, hovering around 3-4. Specifically, it appears to be around 4 from approximately User Position 20 to 24, then drops to around 3 from 24 to 28, and then to approximately 2.5 from 28 to 30.
* **Between User Position 30 and 40:** The Query Budget remains relatively stable at approximately 2.5.
* **Between User Position 40 and 50:** The Query Budget shows a slight decrease, then a step down to approximately 2.
* **At User Position 50:** The Query Budget drops significantly to approximately 1 (10⁰).
* **From User Position 50 to 80 (and beyond):** The Query Budget remains constant at approximately 1 (10⁰).
### Key Observations
* The most significant drop in Query Budget occurs in the initial user positions (0-10).
* There are several plateaus and step-wise decreases in the Query Budget as User Position increases, suggesting discrete changes or thresholds.
* After User Position 50, the Query Budget stabilizes at its minimum value of approximately 1.
### Interpretation
This chart suggests that the "Query Budget" is highly dependent on the "User Position (Chosen Randomly)". The steep initial decline indicates that early user positions are associated with a much higher query budget. As the user position progresses, the query budget diminishes, eventually reaching a floor of approximately 1. The stepped nature of the curve might represent different tiers or categories of users, where the budget is adjusted in discrete steps based on their position. The stabilization at the end implies that beyond a certain user position (around 50), there is no further reduction in the query budget, or it has reached its minimum allocation. This could be relevant in scenarios like resource allocation, where early engagement or priority is given a higher budget, and later engagement receives a reduced, but constant, budget.