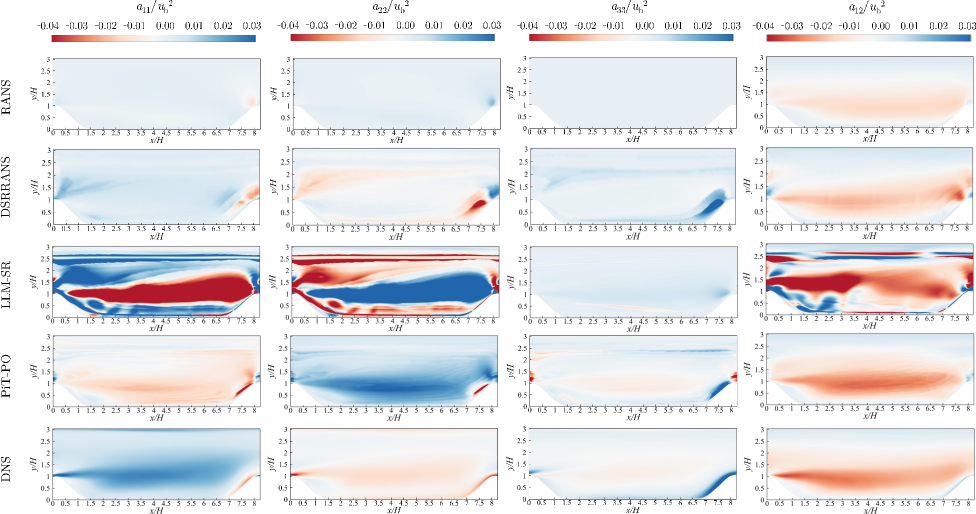
## Heatmap: Coefficient Variations Across Turbulence Models
### Overview
The image presents a 5x3 grid of heatmaps comparing normalized turbulence coefficients (a₁₁, a₂₂, a₃₃) across five turbulence modeling approaches: RANS, DSRANS, LLM-SR, PiT-PO, and DNS. Each panel visualizes spatial distributions of coefficients normalized by τₑ² (wall shear stress squared), with color gradients from blue (low values) to red (high values). The spatial domain is normalized by H (domain height) on both axes.
### Components/Axes
- **Rows**: Turbulence models (top to bottom):
1. RANS
2. DSRANS
3. LLM-SR
4. PiT-PO
5. DNS
- **Columns**: Coefficients (left to right):
1. a₁₁/τₑ² (streamwise component)
2. a₂₂/τₑ² (spanwise component)
3. a₃₃/τₑ² (normal component)
- **Axes**:
- X-axis: x/H (normalized streamwise position, 0–8)
- Y-axis: y/H (normalized wall-normal position, 0–2.5)
- **Legend**: Right-aligned colorbar (blue=low, red=high values)
### Detailed Analysis
- **RANS/DNS Panels**:
- Uniform coloration (blue to light red) across all coefficients.
- a₁₁/τₑ² (first column) shows minimal variation, suggesting steady streamwise behavior.
- a₃₃/τₑ² (third column) exhibits slight reddening near y/H=0.5, indicating localized normal stress.
- **LLM-SR/PiT-PO Panels**:
- Strong red regions in a₂₂/τₑ² (second column), particularly near y/H=1.5–2.0, suggesting dominant spanwise turbulence.
- a₃₃/τₑ² (third column) shows alternating red/blue bands, implying oscillatory normal stress.
- **DSRANS Panel**:
- Moderate red patches in a₁₁/τₑ² (first column) near x/H=4–6, indicating transient streamwise fluctuations.
### Key Observations
1. **DNS as Reference**:
- Most uniform distributions across all coefficients, aligning with direct numerical simulation's accuracy.
2. **LLM-SR/PiT-PO Anomalies**:
- a₂₂/τₑ² (spanwise) dominates in these models, with localized high-intensity regions absent in RANS/DSRANS.
3. **a₃₃/τₑ² Variability**:
- Normal component (third column) shows the most pronounced spatial heterogeneity, especially in LLM-SR/PiT-PO.
### Interpretation
The heatmaps reveal critical differences in how turbulence models capture anisotropic stress components. LLM-SR and PiT-PO exhibit enhanced sensitivity to spanwise (a₂₂) and normal (a₃₃) turbulence, likely due to advanced subgrid modeling. RANS/DSRANS, while computationally efficient, underresolve these components, showing smoother distributions. The DNS results validate the models' limitations, with LLM-SR/PiT-PO approaching but not fully replicating DNS's spatial complexity. The normalized coefficients suggest that wall-normal position (y/H) is a key driver of anisotropy, with high-y/H regions (near the domain top) showing stronger spanwise/normal coupling. This aligns with boundary layer transition physics, where turbulence becomes more three-dimensional away from the wall.