## Chart Type: Line Graphs Comparing Validation Loss vs. Image Resolution
### Overview
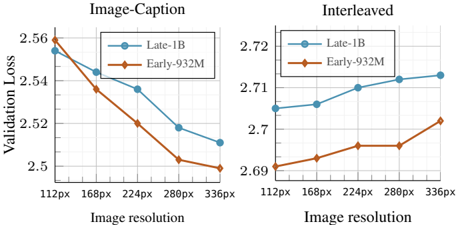
The image presents two line graphs side-by-side, comparing the validation loss of two models, "Late-1B" and "Early-932M," across different image resolutions. The left graph is titled "Image-Caption," and the right graph is titled "Interleaved." Both graphs share the same x-axis (Image resolution) and y-axis (Validation Loss), but display different trends for the two models.
### Components/Axes
* **X-axis (Image resolution):** Categorical axis with values 112px, 168px, 224px, 280px, and 336px.
* **Y-axis (Validation Loss):** Numerical axis.
* Left graph ("Image-Caption"): Ranges from approximately 2.50 to 2.56.
* Right graph ("Interleaved"): Ranges from approximately 2.69 to 2.72.
* **Legend:** Present in both graphs.
* Blue line with circle markers: "Late-1B"
* Brown/Orange line with diamond markers: "Early-932M"
* **Titles:**
* Left graph: "Image-Caption"
* Right graph: "Interleaved"
### Detailed Analysis
**Left Graph ("Image-Caption"):**
* **Late-1B (Blue):** The line slopes downward.
* 112px: Approximately 2.555
* 168px: Approximately 2.545
* 224px: Approximately 2.537
* 280px: Approximately 2.518
* 336px: Approximately 2.512
* **Early-932M (Brown/Orange):** The line slopes downward.
* 112px: Approximately 2.56
* 168px: Approximately 2.537
* 224px: Approximately 2.52
* 280px: Approximately 2.503
* 336px: Approximately 2.498
**Right Graph ("Interleaved"):**
* **Late-1B (Blue):** The line slopes slightly upward.
* 112px: Approximately 2.704
* 168px: Approximately 2.706
* 224px: Approximately 2.712
* 280px: Approximately 2.713
* 336px: Approximately 2.714
* **Early-932M (Brown/Orange):** The line slopes upward.
* 112px: Approximately 2.691
* 168px: Approximately 2.693
* 224px: Approximately 2.696
* 280px: Approximately 2.696
* 336px: Approximately 2.702
### Key Observations
* In the "Image-Caption" scenario, both models exhibit a decrease in validation loss as image resolution increases.
* In the "Interleaved" scenario, both models exhibit an increase in validation loss as image resolution increases, but the increase is more pronounced for "Early-932M."
* The "Early-932M" model has a higher validation loss than the "Late-1B" model at the lowest resolution (112px) in the "Image-Caption" scenario, but the "Early-932M" model has a lower validation loss than the "Late-1B" model at all resolutions in the "Interleaved" scenario.
### Interpretation
The graphs suggest that the performance of the "Late-1B" and "Early-932M" models is affected differently by image resolution depending on the task ("Image-Caption" vs. "Interleaved"). For "Image-Caption," higher resolution images lead to lower validation loss for both models, indicating improved performance. However, for "Interleaved," higher resolution images lead to higher validation loss, suggesting a potential overfitting or difficulty in processing higher resolution images for this specific task. The "Early-932M" model seems to be more sensitive to changes in image resolution in the "Interleaved" scenario compared to the "Late-1B" model. The difference in trends between the two tasks highlights the importance of considering the specific task when evaluating model performance across different image resolutions.