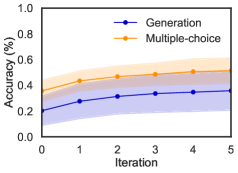
## Chart Type: Line Chart with Confidence Intervals: Accuracy over Iterations for Generation and Multiple-choice Tasks
### Overview
This image displays a 2D line chart illustrating the "Accuracy (%)" on the Y-axis against "Iteration" on the X-axis. Two distinct data series, "Generation" and "Multiple-choice," are plotted, each showing their mean accuracy as a line with circular markers and a surrounding shaded region representing a confidence interval or variability. The chart demonstrates how the accuracy of these two tasks evolves over a series of iterations.
### Components/Axes
* **X-axis Label**: "Iteration"
* Range: From 0 to 5.
* Major Ticks: 0, 1, 2, 3, 4, 5.
* **Y-axis Label**: "Accuracy (%)"
* Range: From 0.0 to 1.0.
* Major Ticks: 0.0, 0.2, 0.4, 0.6, 0.8, 1.0.
* **Legend**: Located in the top-right quadrant of the plot area.
* **Generation**: Represented by a dark blue line with solid blue circular markers. The associated confidence interval is shaded in light blue.
* **Multiple-choice**: Represented by an orange line with solid orange circular markers. The associated confidence interval is shaded in light orange.
### Detailed Analysis
The chart presents two data series, each showing an upward trend in accuracy as the number of iterations increases.
1. **Generation Series (Dark blue line with blue circles, light blue shaded region)**:
* **Trend**: The "Generation" accuracy starts at a lower point and generally increases with each iteration, though the rate of increase slows down significantly after Iteration 2 or 3.
* **Approximate Data Points**:
* Iteration 0: Accuracy is approximately 0.22%. The confidence interval spans roughly from 0.10% to 0.35%.
* Iteration 1: Accuracy is approximately 0.28%.
* Iteration 2: Accuracy is approximately 0.32%.
* Iteration 3: Accuracy is approximately 0.35%.
* Iteration 4: Accuracy is approximately 0.36%.
* Iteration 5: Accuracy is approximately 0.37%. The confidence interval spans roughly from 0.30% to 0.45%.
* The light blue shaded region indicates the variability or confidence interval around the mean accuracy for the "Generation" task.
2. **Multiple-choice Series (Orange line with orange circles, light orange shaded region)**:
* **Trend**: The "Multiple-choice" accuracy starts at a higher point than "Generation" and consistently maintains a higher accuracy throughout all iterations. It also shows an increasing trend, with the rate of increase diminishing after Iteration 2 or 3, similar to the "Generation" series.
* **Approximate Data Points**:
* Iteration 0: Accuracy is approximately 0.37%. The confidence interval spans roughly from 0.30% to 0.45%.
* Iteration 1: Accuracy is approximately 0.43%.
* Iteration 2: Accuracy is approximately 0.47%.
* Iteration 3: Accuracy is approximately 0.49%.
* Iteration 4: Accuracy is approximately 0.51%.
* Iteration 5: Accuracy is approximately 0.52%. The confidence interval spans roughly from 0.45% to 0.55%.
* The light orange shaded region indicates the variability or confidence interval around the mean accuracy for the "Multiple-choice" task.
### Key Observations
* Both "Generation" and "Multiple-choice" tasks show an improvement in accuracy as the number of iterations increases from 0 to 5.
* The "Multiple-choice" task consistently achieves significantly higher accuracy than the "Generation" task across all iterations.
* The confidence intervals for the two series are largely non-overlapping, especially after Iteration 0, suggesting a statistically significant difference in performance between the two tasks.
* The rate of accuracy improvement for both tasks appears to slow down after approximately 2-3 iterations, indicating a potential plateau in performance gains.
* At Iteration 5, the "Multiple-choice" task reaches an accuracy of about 0.52%, while the "Generation" task reaches about 0.37%.
### Interpretation
This chart suggests that, under the conditions represented by "Iterations," the "Multiple-choice" task is inherently easier or the system performs more effectively on it compared to the "Generation" task. The consistent and substantial gap in accuracy, coupled with non-overlapping confidence intervals, strongly supports this conclusion. Both tasks benefit from increased iterations, implying a learning process or optimization over time. However, the diminishing returns on accuracy after a few iterations for both tasks indicate that the systems are approaching their performance limits within the observed iteration range. This could mean that further iterations might yield only marginal improvements, or that other factors (e.g., model architecture, data quality, task complexity) become the primary bottlenecks for higher accuracy. The data highlights a clear performance disparity between the two task types, which could inform decisions about task design, model selection, or resource allocation in a system that handles both generation and multiple-choice challenges.