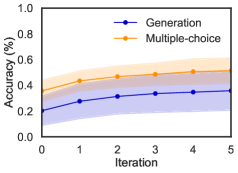
## Line Chart: Accuracy vs. Iteration
### Overview
The image is a line chart comparing the accuracy of two methods, "Generation" and "Multiple-choice," across iterations. The chart displays accuracy (in percentage) on the y-axis and iteration number on the x-axis. Shaded regions around each line indicate variability or uncertainty.
### Components/Axes
* **Title:** Accuracy vs. Iteration (inferred)
* **X-axis:** Iteration, labeled from 0 to 5 in increments of 1.
* **Y-axis:** Accuracy (%), labeled from 0.0 to 1.0 in increments of 0.2.
* **Legend:** Located in the top-right corner.
* Blue line: Generation
* Orange line: Multiple-choice
### Detailed Analysis
* **Generation (Blue Line):**
* Trend: The line slopes upward, indicating increasing accuracy with more iterations.
* Data Points:
* Iteration 0: Accuracy ~0.2
* Iteration 1: Accuracy ~0.28
* Iteration 2: Accuracy ~0.31
* Iteration 3: Accuracy ~0.33
* Iteration 4: Accuracy ~0.34
* Iteration 5: Accuracy ~0.36
* **Multiple-choice (Orange Line):**
* Trend: The line slopes upward, indicating increasing accuracy with more iterations.
* Data Points:
* Iteration 0: Accuracy ~0.35
* Iteration 1: Accuracy ~0.43
* Iteration 2: Accuracy ~0.47
* Iteration 3: Accuracy ~0.49
* Iteration 4: Accuracy ~0.51
* Iteration 5: Accuracy ~0.52
### Key Observations
* The "Multiple-choice" method consistently shows higher accuracy than the "Generation" method across all iterations.
* Both methods show an increase in accuracy as the number of iterations increases, but the rate of increase appears to diminish after the first few iterations.
* The shaded regions around the lines suggest that there is some variability in the accuracy of both methods.
### Interpretation
The chart suggests that the "Multiple-choice" method is more accurate than the "Generation" method in this context. The increasing accuracy with more iterations indicates that both methods benefit from iterative refinement or learning. The diminishing rate of increase suggests that there may be a point of diminishing returns for both methods, where additional iterations do not significantly improve accuracy. The shaded regions indicate that the accuracy of both methods can vary, possibly due to factors not controlled in the experiment.