\n
## Line Chart: Accuracy vs. Iteration for Generation and Multiple-Choice Models
### Overview
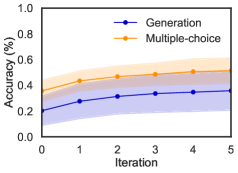
This image presents a line chart comparing the accuracy of two models – "Generation" and "Multiple-choice" – across five iterations. The chart displays the mean accuracy and a shaded region representing the standard deviation or confidence interval around the mean.
### Components/Axes
* **X-axis:** "Iteration", ranging from 0 to 5.
* **Y-axis:** "Accuracy (%)", ranging from 0.0 to 1.0.
* **Data Series 1:** "Generation" – represented by a blue line with circular markers.
* **Data Series 2:** "Multiple-choice" – represented by an orange line with circular markers.
* **Legend:** Located in the top-center of the chart, identifying the two data series by color and label.
* **Shaded Regions:** Blue shaded region around the "Generation" line, and orange shaded region around the "Multiple-choice" line, indicating variability.
### Detailed Analysis
**Generation (Blue Line):**
The blue line representing "Generation" accuracy shows an upward trend from Iteration 0 to Iteration 2, then plateaus.
* Iteration 0: Approximately 0.15 accuracy.
* Iteration 1: Approximately 0.25 accuracy.
* Iteration 2: Approximately 0.33 accuracy.
* Iteration 3: Approximately 0.35 accuracy.
* Iteration 4: Approximately 0.35 accuracy.
* Iteration 5: Approximately 0.35 accuracy.
The shaded blue region indicates a relatively wide confidence interval, particularly at lower iteration values.
**Multiple-choice (Orange Line):**
The orange line representing "Multiple-choice" accuracy shows a slight downward trend from Iteration 0 to Iteration 1, then remains relatively stable.
* Iteration 0: Approximately 0.52 accuracy.
* Iteration 1: Approximately 0.45 accuracy.
* Iteration 2: Approximately 0.50 accuracy.
* Iteration 3: Approximately 0.50 accuracy.
* Iteration 4: Approximately 0.52 accuracy.
* Iteration 5: Approximately 0.52 accuracy.
The shaded orange region also indicates variability, but appears slightly narrower than the blue region.
### Key Observations
* The "Multiple-choice" model consistently exhibits higher accuracy than the "Generation" model across all iterations.
* The "Generation" model shows the most significant improvement in accuracy during the first two iterations.
* Both models appear to converge in accuracy after Iteration 2, with minimal changes observed in subsequent iterations.
* The confidence intervals (shaded regions) suggest greater uncertainty in the "Generation" model's accuracy, especially at lower iterations.
### Interpretation
The data suggests that the "Multiple-choice" approach is more effective than the "Generation" approach for the task being evaluated, as indicated by its consistently higher accuracy. The "Generation" model demonstrates initial learning (improvement from Iteration 0 to 2), but its performance plateaus, suggesting it may have reached its limit or requires further refinement. The wider confidence intervals for the "Generation" model suggest that its performance is more variable and less reliable. The convergence of the two lines after Iteration 2 indicates that both models are approaching a stable state, and further iterations may not yield significant improvements. This could be due to the nature of the task, the limitations of the models, or the training data. The chart provides a clear visual comparison of the two models' performance and highlights the strengths and weaknesses of each approach.