## Line Chart: Accuracy vs. Iteration for Two Methods
### Overview
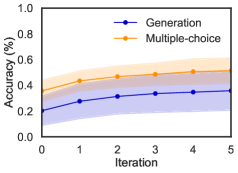
The image is a line chart comparing the performance of two methods, "Generation" and "Multiple-choice," over a series of iterations. The chart plots accuracy percentage against iteration number, showing the progression and variability of each method's performance.
### Components/Axes
* **Chart Type:** Line chart with shaded confidence intervals.
* **Y-Axis:** Labeled "Accuracy (%)". Scale ranges from 0.0 to 1.0, with major tick marks at 0.0, 0.2, 0.4, 0.6, 0.8, and 1.0.
* **X-Axis:** Labeled "Iteration". Scale ranges from 0 to 5, with major tick marks at 0, 1, 2, 3, 4, and 5.
* **Legend:** Located in the top-left corner of the plot area.
* Blue line with circular markers: "Generation"
* Orange line with circular markers: "Multiple-choice"
* **Data Series:** Two lines, each with a shaded band (likely representing a confidence interval or standard deviation).
* **Generation (Blue):** Starts lower, increases gradually.
* **Multiple-choice (Orange):** Starts higher, increases more steeply.
### Detailed Analysis
**Trend Verification:**
* **Generation (Blue Line):** Shows a steady, moderate upward slope from iteration 0 to 5.
* **Multiple-choice (Orange Line):** Shows a steeper upward slope, particularly between iterations 0 and 2, then continues to rise.
**Approximate Data Points (Visual Estimation):**
* **Iteration 0:**
* Generation: ~0.22 (22%)
* Multiple-choice: ~0.38 (38%)
* **Iteration 1:**
* Generation: ~0.28 (28%)
* Multiple-choice: ~0.48 (48%)
* **Iteration 2:**
* Generation: ~0.32 (32%)
* Multiple-choice: ~0.52 (52%)
* **Iteration 3:**
* Generation: ~0.35 (35%)
* Multiple-choice: ~0.55 (55%)
* **Iteration 4:**
* Generation: ~0.36 (36%)
* Multiple-choice: ~0.58 (58%)
* **Iteration 5:**
* Generation: ~0.37 (37%)
* Multiple-choice: ~0.60 (60%)
**Shaded Regions (Confidence Intervals):**
* The shaded blue area around the "Generation" line spans approximately ±0.15 (15%) in accuracy at its widest point (around iteration 2-3).
* The shaded orange area around the "Multiple-choice" line spans approximately ±0.10 (10%) in accuracy at its widest point (around iteration 1-2).
* The bands for both methods narrow slightly as iterations increase, suggesting reduced variance in later stages.
### Key Observations
1. **Performance Gap:** The "Multiple-choice" method consistently outperforms the "Generation" method at every measured iteration. The initial gap at iteration 0 is approximately 16 percentage points.
2. **Growth Rate:** "Multiple-choice" shows a faster rate of improvement, especially in the early iterations (0 to 2). Its accuracy nearly doubles from ~38% to ~52% in the first two iterations.
3. **Convergence:** Both methods show continued improvement through iteration 5, with no clear plateau. The performance gap between them remains relatively stable after iteration 2.
4. **Variability:** The "Generation" method exhibits higher variability (wider confidence band) compared to "Multiple-choice," particularly in the middle iterations.
### Interpretation
The data suggests that for the task being measured, the "Multiple-choice" approach is fundamentally more effective than the "Generation" approach, starting from a higher baseline accuracy and improving more rapidly. The steeper initial slope for "Multiple-choice" indicates it learns or adapts more efficiently in the early stages.
The persistent gap implies a core advantage in the "Multiple-choice" methodology that is not overcome by additional iterations within the observed range. The narrowing confidence intervals for both methods suggest that performance becomes more consistent and predictable as the process iterates.
From a Peircean perspective, the chart acts as an indexical sign of a learning or optimization process. The upward trends are iconic of improvement. The key symbolic takeaway is the superiority of selection-based ("Multiple-choice") over generative methods for this specific metric and timeframe. The investigation would next question *why* this gap exists—is it due to the nature of the task, the quality of the choices provided, or an inherent limitation in the generative model's precision?