\n
## Diagram: Causal Relationship Model
### Overview
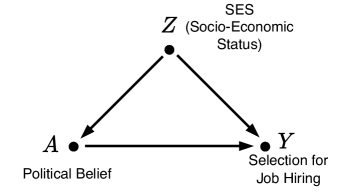
The image depicts a diagram illustrating a causal relationship model between three variables: Political Belief, Socio-Economic Status (SES), and Selection for Job Hiring. The diagram uses a triangular structure with arrows indicating the direction of influence between the variables.
### Components/Axes
The diagram consists of three nodes, each representing a variable:
* **A:** Political Belief
* **Z:** Socio-Economic Status (SES)
* **Y:** Selection for Job Hiring
Arrows connect the nodes, indicating causal relationships. The diagram does not have traditional axes or scales.
### Detailed Analysis or Content Details
The diagram shows the following relationships:
* An arrow points from 'A' (Political Belief) to 'Z' (SES).
* An arrow points from 'Z' (SES) to 'Y' (Selection for Job Hiring).
* An arrow points from 'A' (Political Belief) to 'Y' (Selection for Job Hiring).
The nodes are positioned as vertices of a triangle. 'A' is at the bottom-left, 'Z' is at the top-center, and 'Y' is at the bottom-right. The text labels are positioned directly below or above their respective nodes.
### Key Observations
The diagram suggests a model where both Political Belief and Socio-Economic Status influence Selection for Job Hiring. Additionally, Political Belief appears to influence Socio-Economic Status. There are no numerical values or quantitative data presented in the diagram.
### Interpretation
The diagram illustrates a potential model of how political beliefs and socio-economic status might interact to influence job hiring decisions. It suggests that political beliefs can directly impact hiring decisions, but also indirectly through their influence on socio-economic status. This model could be used to explore potential biases in hiring practices. The diagram is a conceptual representation and does not provide any data to support or refute the relationships depicted. It is a theoretical framework for investigation. The absence of quantitative data means the strength or magnitude of these relationships is unknown. The diagram implies a complex interplay of factors, rather than a simple linear relationship.