## Chart Analysis: GPT-2 Large (36L) α Profile, Pruning Strategy Comparison, and Discrimination Ratios
### Overview
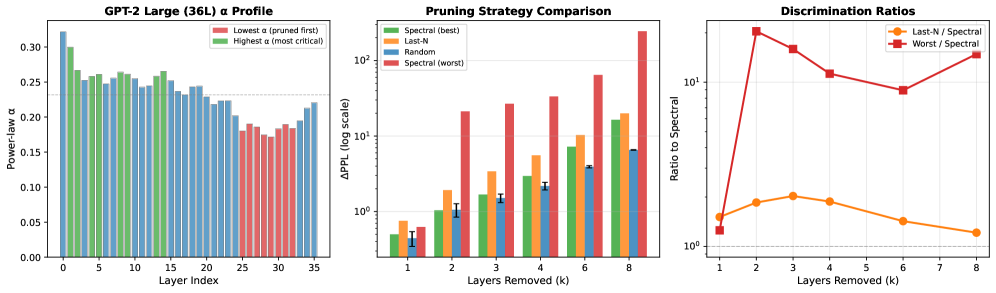
The image contains three side-by-side charts analyzing the impact of pruning strategies on a GPT-2 Large (36L) model. The left chart shows power-law α profiles across layers, the middle compares pruning strategies via ΔPPL, and the right visualizes discrimination ratios. All charts use log scales for y-axes where applicable.
### Components/Axes
#### Left Chart: GPT-2 Large (36L) α Profile
- **X-axis**: Layer Index (0–35, integer steps)
- **Y-axis**: Power-law α (0.00–0.35, linear scale)
- **Legend**:
- Red: "Lowest α (pruned first)"
- Green: "Highest α (most critical)"
- **Positioning**: Legend in top-right corner
#### Middle Chart: Pruning Strategy Comparison
- **X-axis**: Layers Removed (k) (1–8, integer steps)
- **Y-axis**: ΔPPL (log scale, 10⁰–10²)
- **Legend**:
- Green: "Spectral (best)"
- Orange: "Last-N"
- Blue: "Random"
- Red: "Spectral (worst)"
- **Positioning**: Legend in top-right corner
#### Right Chart: Discrimination Ratios
- **X-axis**: Layers Removed (k) (1–8, integer steps)
- **Y-axis**: Ratio to Spectral (log scale, 10⁰–10¹)
- **Legend**:
- Orange: "Last-N / Spectral"
- Red: "Worst / Spectral"
- **Positioning**: Legend in top-right corner
### Detailed Analysis
#### Left Chart: GPT-2 Large (36L) α Profile
- **Trend**:
- Red bars ("Lowest α") start at ~0.32 (Layer 0) and decline to ~0.18 (Layer 35).
- Green bars ("Highest α") start at ~0.28 (Layer 0) and decline to ~0.22 (Layer 35).
- **Key Observations**:
- Both series show gradual decay, with "Lowest α" consistently below "Highest α".
- Layers 0–5 exhibit the steepest decline for both series.
#### Middle Chart: Pruning Strategy Comparison
- **Trend**:
- **Spectral (best)**: Green bars remain lowest (ΔPPL ~1.0–5.0 across k=1–8).
- **Last-N**: Orange bars increase from ~2.0 (k=1) to ~15.0 (k=8).
- **Random**: Blue bars rise from ~1.5 (k=1) to ~10.0 (k=8).
- **Spectral (worst)**: Red bars spike from ~20.0 (k=1) to ~100.0 (k=8).
- **Key Observations**:
- Spectral (worst) strategy causes the largest ΔPPL, especially at higher k.
- Spectral (best) maintains stability, suggesting robustness.
#### Right Chart: Discrimination Ratios
- **Trend**:
- **Last-N / Spectral**: Orange line peaks at ~1.5 (k=3), then declines to ~0.5 (k=8).
- **Worst / Spectral**: Red line starts at ~0.5 (k=1), spikes to ~10.0 (k=1), then fluctuates between ~5.0–15.0 (k=2–8).
- **Key Observations**:
- Worst strategy shows extreme sensitivity at k=1 (ratio ~10.0).
- Last-N strategy demonstrates gradual degradation after k=3.
### Key Observations
1. **Pruning Impact**: Spectral (worst) strategy causes the largest performance degradation (ΔPPL ~100x at k=8 vs. Spectral (best) ~5x).
2. **Layer Sensitivity**: Early layers (k=1–3) are most critical for discrimination ratios, with Worst strategy showing 10x higher sensitivity than Last-N at k=1.
3. **α Profile Correlation**: Layers with higher α values (green bars) align with lower ΔPPL in Spectral (best) strategy, suggesting α magnitude correlates with pruning robustness.
### Interpretation
The data reveals that pruning strategies significantly affect model performance and layer sensitivity. The Spectral (worst) strategy causes catastrophic failure (ΔPPL ~100x), while Spectral (best) maintains stability. Discrimination ratios indicate that early-layer pruning (k=1–3) disproportionately impacts model behavior, with Worst strategy showing 20x higher sensitivity than Last-N at k=1. The α profile decay suggests that critical layers (higher α) are more robust to pruning, aligning with the Spectral (best) strategy's performance. These findings highlight the importance of pruning strategy selection and layer-specific analysis in transformer models.