## 3D Surface Plot: Free Energy vs. Theta 1 and Theta 2
### Overview
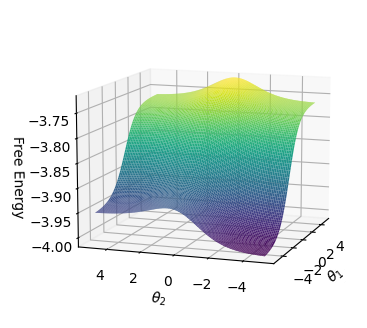
The image is a 3D surface plot visualizing the relationship between "Free Energy" (z-axis) and two variables, "theta1" (x-axis) and "theta2" (y-axis). The surface is colored according to the free energy value, with lower values represented by purple/blue and higher values by yellow/green.
### Components/Axes
* **X-axis:** theta1, ranging from approximately -5 to 5.
* **Y-axis:** theta2, ranging from approximately -5 to 5.
* **Z-axis:** Free Energy, ranging from -4.00 to -3.75.
### Detailed Analysis
The surface shows a valley-like structure.
* **Trend along theta1:** The free energy generally decreases as theta1 moves from -5 to 0, then increases as theta1 moves from 0 to 5.
* **Trend along theta2:** The free energy generally decreases as theta2 moves from -5 to 0, then increases as theta2 moves from 0 to 5.
* **Minimum Free Energy:** The minimum free energy appears to be located near theta1 = 0 and theta2 = 0, with a value close to -4.00.
* **Maximum Free Energy:** The maximum free energy appears to be located near theta1 = -5 and theta2 = -5, and also near theta1 = 5 and theta2 = 5, with a value close to -3.75.
### Key Observations
* The surface is relatively smooth, indicating a continuous relationship between the variables.
* The plot suggests a potential energy landscape with a single minimum.
### Interpretation
The plot visualizes a free energy landscape as a function of two angular parameters, theta1 and theta2. The shape of the surface suggests that the system has a preferred configuration where theta1 and theta2 are close to zero, corresponding to the minimum free energy. The plot could represent the energy landscape of a molecular system, where theta1 and theta2 are dihedral angles. The system will tend to reside in the configuration with the lowest free energy.