\n
## 3D Surface Plot: Free Energy Landscape
### Overview
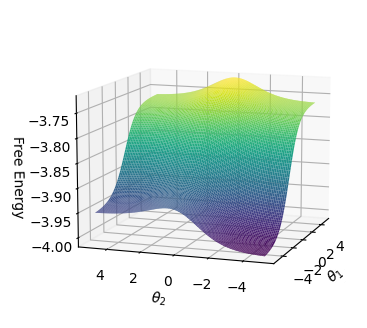
The image presents a 3D surface plot visualizing a free energy landscape as a function of two angular parameters, θ₁ and θ₂. The surface is color-coded to represent the free energy values, ranging from approximately -3.75 to -4.00. The plot suggests a complex energy landscape with multiple local minima and a broad maximum.
### Components/Axes
* **X-axis:** θ₁ (Theta 1), ranging from approximately -4 to 4.
* **Y-axis:** θ₂ (Theta 2), ranging from approximately -4 to 4.
* **Z-axis:** Free Energy, ranging from approximately -4.00 to -3.75.
* **Color Scale:** Represents Free Energy values. Purple/Dark Blue indicates lower free energy (approximately -4.00), transitioning through Green and Yellow to indicate higher free energy (approximately -3.75).
### Detailed Analysis
The surface exhibits a complex shape.
* **Minimum 1:** A prominent minimum is located around θ₁ ≈ -3, θ₂ ≈ -3, with a free energy value of approximately -4.00.
* **Minimum 2:** Another minimum is observed around θ₁ ≈ 3, θ₂ ≈ -3, with a free energy value of approximately -4.00.
* **Maximum:** A broad maximum is located around θ₁ ≈ 0, θ₂ ≈ 2, with a free energy value of approximately -3.75.
* **Trend along θ₁:** For a fixed θ₂, the free energy generally increases as θ₁ moves from negative to positive values, then decreases again.
* **Trend along θ₂:** For a fixed θ₁, the free energy exhibits a more complex behavior, with local minima and maxima.
* **Saddle Point:** A saddle point appears around θ₁ ≈ -2, θ₂ ≈ 2, where the surface curves up in one direction and down in another.
### Key Observations
* The energy landscape is not symmetric with respect to either θ₁ or θ₂.
* The presence of multiple minima suggests the possibility of multiple stable states or conformations.
* The broad maximum indicates a region of high energy, potentially representing a transition state between different minima.
* The color gradient is smooth, indicating a continuous energy landscape.
### Interpretation
This plot likely represents the free energy surface of a system with two rotational degrees of freedom (θ₁ and θ₂). The minima on the surface correspond to stable configurations of the system, while the maxima represent unstable configurations. The shape of the surface dictates the dynamics of the system, influencing the rates of transitions between different states. The asymmetry of the landscape suggests that the system is not isotropic. The presence of multiple minima indicates that the system can exist in multiple stable states, and the relative populations of these states will depend on the temperature and other external factors. The plot could be used to understand the conformational landscape of a molecule, the potential energy surface of a chemical reaction, or the state space of a physical system. The data suggests a system that is not easily perturbed from its stable states, but can transition between them via the higher energy saddle point.