## 3D Surface Plot: Free Energy Landscape
### Overview
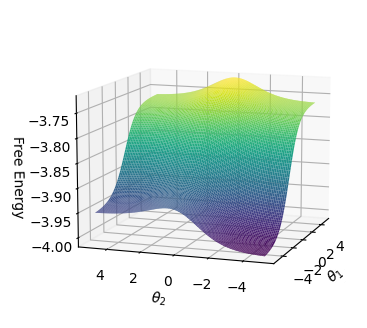
The image depicts a 3D surface plot representing a "Free Energy" landscape as a function of two variables, θ₁ and θ₂. The plot uses a color gradient (purple to yellow) to indicate varying Free Energy values, with grid lines and axis markers for spatial orientation.
### Components/Axes
- **X-axis (θ₁)**: Ranges from -4 to 4, labeled "θ₁".
- **Y-axis (θ₂)**: Ranges from -4 to 4, labeled "θ₂".
- **Z-axis (Free Energy)**: Ranges from -4.00 to -3.75, labeled "Free Energy".
- **Surface**: A continuous, undulating surface with no explicit legend or colorbar. The color gradient transitions from purple (lowest Free Energy) to yellow (highest Free Energy).
- **Grid Lines**: Faint grid lines on all three axes for reference.
### Detailed Analysis
- **Free Energy Values**:
- **Highest Point**: At θ₁ ≈ 2, θ₂ ≈ 2, Free Energy ≈ -3.75 (yellow region).
- **Lowest Point**: At θ₁ ≈ -4, θ₂ ≈ -4, Free Energy ≈ -4.00 (dark purple region).
- **Intermediate Values**: The surface shows a saddle-like structure, with a ridge connecting the peak and trough.
- **Color Gradient**: No explicit legend is present, but the gradient suggests a mapping from purple (minimum) to yellow (maximum).
### Key Observations
1. **Saddle Shape**: The surface exhibits a saddle point, indicating a critical point where the Free Energy transitions between minima and maxima.
2. **Asymmetry**: The plot is not symmetric; the peak is offset toward positive θ₁ and θ₂ values, while the trough is at negative extremes.
3. **No Data Points**: No discrete data points or annotations are marked on the surface.
### Interpretation
The plot likely represents a potential energy landscape in a physical or chemical system, where θ₁ and θ₂ are parameters (e.g., angles, concentrations, or other variables). The saddle point suggests a transition state between two energy minima, which is critical in understanding system dynamics (e.g., reaction pathways or equilibrium states). The absence of a legend leaves the color gradient’s exact meaning ambiguous, but the z-axis values provide clear Free Energy thresholds. The asymmetry in the surface implies that the system’s behavior is sensitive to the relative magnitudes of θ₁ and θ₂.
## Language Note
No non-English text is present in the image.