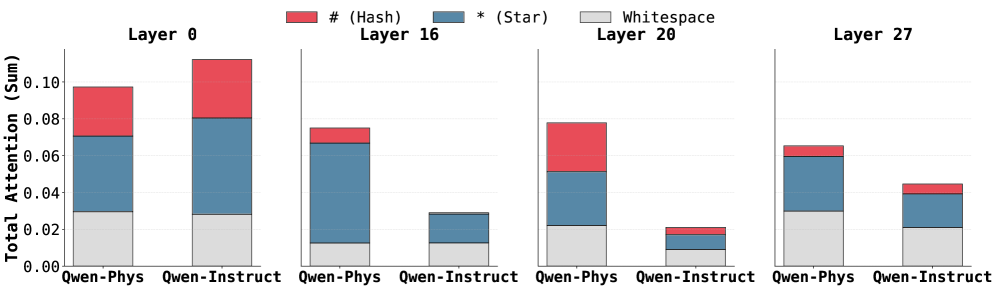
## Stacked Bar Chart: Total Attention by Layer and Input Type
### Overview
The image presents a series of stacked bar charts comparing the total attention (sum) across different layers (0, 16, 20, and 27) for two input types: "Qwen-Phys" and "Qwen-Instruct". The attention is broken down into three components: "# (Hash)", "* (Star)", and "Whitespace". Each layer has a pair of stacked bars, one for each input type.
### Components/Axes
* **Y-axis:** "Total Attention (Sum)". The scale ranges from 0.00 to 0.10, with tick marks at 0.02 intervals.
* **X-axis:** Categorical, representing the input types "Qwen-Phys" and "Qwen-Instruct" for each layer.
* **Layers:** The chart is divided into four sections, each labeled with a layer number: "Layer 0", "Layer 16", "Layer 20", and "Layer 27".
* **Legend:** Located at the top of the chart.
* Red: "# (Hash)"
* Blue: "* (Star)"
* Gray: "Whitespace"
### Detailed Analysis
**Layer 0:**
* Qwen-Phys:
* Whitespace: ~0.03
* Star: ~0.04
* Hash: ~0.03
* Total: ~0.10
* Qwen-Instruct:
* Whitespace: ~0.03
* Star: ~0.05
* Hash: ~0.03
* Total: ~0.11
**Layer 16:**
* Qwen-Phys:
* Whitespace: ~0.01
* Star: ~0.06
* Hash: ~0.01
* Total: ~0.08
* Qwen-Instruct:
* Whitespace: ~0.01
* Star: ~0.02
* Hash: ~0.00
* Total: ~0.03
**Layer 20:**
* Qwen-Phys:
* Whitespace: ~0.02
* Star: ~0.03
* Hash: ~0.03
* Total: ~0.08
* Qwen-Instruct:
* Whitespace: ~0.01
* Star: ~0.01
* Hash: ~0.00
* Total: ~0.02
**Layer 27:**
* Qwen-Phys:
* Whitespace: ~0.02
* Star: ~0.04
* Hash: ~0.01
* Total: ~0.07
* Qwen-Instruct:
* Whitespace: ~0.02
* Star: ~0.02
* Hash: ~0.01
* Total: ~0.05
### Key Observations
* Total attention generally decreases as the layer number increases.
* "Qwen-Instruct" consistently has lower total attention compared to "Qwen-Phys" for layers 16, 20, and 27.
* The proportion of "Whitespace" attention remains relatively stable across different layers and input types.
* The "* (Star)" component appears to be the most significant contributor to the total attention, especially in the earlier layers.
* The "# (Hash)" component is relatively small in layers 16, 20, and 27.
### Interpretation
The stacked bar charts illustrate how attention is distributed across different components ("# (Hash)", "* (Star)", and "Whitespace") within different layers of a model for two input types ("Qwen-Phys" and "Qwen-Instruct"). The decreasing total attention with increasing layer number suggests that the model focuses more on earlier layers for processing information. The difference in attention between "Qwen-Phys" and "Qwen-Instruct" indicates that the model processes these input types differently, with "Qwen-Phys" generally receiving more attention. The relative stability of "Whitespace" attention might indicate a consistent baseline level of attention allocated to whitespace tokens. The dominance of "* (Star)" suggests that this component plays a crucial role in the model's attention mechanism.