\n
## Stacked Bar Chart: Attention Distribution Across Layers
### Overview
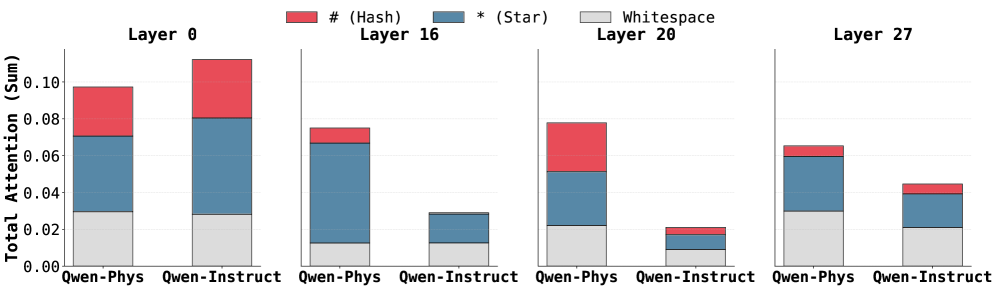
The image presents a stacked bar chart comparing the total attention (sum) allocated to different token types – '# (Hash)', '* (Star)', 'Whitespace' – across four layers (0, 16, 20, and 27) for two conditions: 'Qwen-Phys' and 'Qwen-Instruct'. The chart visualizes how attention is distributed among these token types within each layer and condition.
### Components/Axes
* **X-axis:** Represents the combination of layer and condition. The categories are 'Qwen-Phys' and 'Qwen-Instruct' repeated for each layer (0, 16, 20, 27).
* **Y-axis:** Labeled "Total Attention (Sum)", with a scale ranging from 0.00 to 0.10.
* **Legend:** Located at the top-left corner, identifies the token types with corresponding colors:
* Red: '# (Hash)'
* Blue: '* (Star)'
* Gray: 'Whitespace'
* **Layers:** The chart is divided into four sections, each representing a layer: Layer 0, Layer 16, Layer 20, and Layer 27. Each layer contains two stacked bar groups, one for 'Qwen-Phys' and one for 'Qwen-Instruct'.
### Detailed Analysis
Let's analyze each layer and condition:
**Layer 0:**
* **Qwen-Phys:** Total attention is approximately 0.095. The stack consists of:
* # (Hash): ~0.055
* * (Star): ~0.035
* Whitespace: ~0.005
* **Qwen-Instruct:** Total attention is approximately 0.105. The stack consists of:
* # (Hash): ~0.075
* * (Star): ~0.025
* Whitespace: ~0.005
**Layer 16:**
* **Qwen-Phys:** Total attention is approximately 0.07. The stack consists of:
* # (Hash): ~0.04
* * (Star): ~0.025
* Whitespace: ~0.005
* **Qwen-Instruct:** Total attention is approximately 0.03. The stack consists of:
* # (Hash): ~0.015
* * (Star): ~0.01
* Whitespace: ~0.005
**Layer 20:**
* **Qwen-Phys:** Total attention is approximately 0.04. The stack consists of:
* # (Hash): ~0.02
* * (Star): ~0.015
* Whitespace: ~0.005
* **Qwen-Instruct:** Total attention is approximately 0.02. The stack consists of:
* # (Hash): ~0.01
* * (Star): ~0.005
* Whitespace: ~0.005
**Layer 27:**
* **Qwen-Phys:** Total attention is approximately 0.06. The stack consists of:
* # (Hash): ~0.03
* * (Star): ~0.025
* Whitespace: ~0.005
* **Qwen-Instruct:** Total attention is approximately 0.045. The stack consists of:
* # (Hash): ~0.025
* * (Star): ~0.015
* Whitespace: ~0.005
### Key Observations
* The '# (Hash)' token consistently receives the largest portion of attention across all layers and conditions.
* 'Qwen-Instruct' generally exhibits higher total attention in Layer 0 compared to 'Qwen-Phys'.
* Attention decreases across layers for both conditions, particularly for the '* (Star)' token.
* Whitespace consistently receives the lowest attention across all layers and conditions.
* The difference in attention between 'Qwen-Phys' and 'Qwen-Instruct' diminishes in later layers (20 and 27).
### Interpretation
The chart suggests that the model (likely a large language model) prioritizes the '# (Hash)' token type across different layers. The varying attention levels across layers and conditions indicate how the model processes information differently depending on the input type ('Qwen-Phys' vs. 'Qwen-Instruct'). The decrease in attention across layers could signify that the model refines its focus as it processes information through deeper layers. The higher attention in Layer 0 for 'Qwen-Instruct' might indicate that the initial processing stages are more sensitive to instructional prompts. The diminishing difference in attention between the two conditions in later layers suggests that the model converges towards a similar representation regardless of the initial input type. The low attention to whitespace is expected, as it typically doesn't carry significant semantic meaning. This data could be used to understand the model's internal mechanisms and potentially optimize its performance.