## Bar Chart: Layer-wise Attention Distribution in Qwen-Phys and Qwen-Instruct Models
### Overview
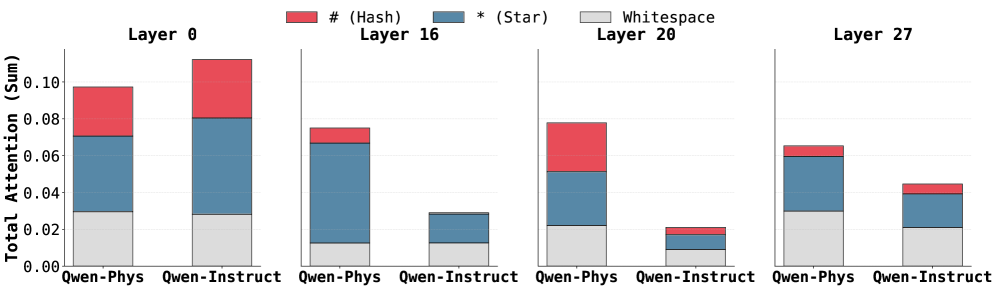
The image displays a grouped bar chart comparing attention distribution across four transformer model layers (0, 16, 20, 27) for two Qwen model variants: Qwen-Phys and Qwen-Instruct. Each bar is segmented into three components: red (#), blue (*), and gray (Whitespace), representing different attention mechanisms. The y-axis measures "Total Attention (Sum)" in normalized units (0.00–0.10).
### Components/Axes
- **X-axis**: Model variants (Qwen-Phys, Qwen-Instruct) repeated for each layer.
- **Y-axis**: Total Attention (Sum) with ticks at 0.00, 0.02, 0.04, 0.06, 0.08, 0.10.
- **Legend**:
- Red (#): Hash attention
- Blue (*): Star attention
- Gray: Whitespace attention
- **Layers**:
- Layer 0 (leftmost)
- Layer 16
- Layer 20
- Layer 27 (rightmost)
### Detailed Analysis
#### Layer 0
- **Qwen-Phys**:
- Hash (~0.03), Star (~0.05), Whitespace (~0.02) → Total ~0.10
- **Qwen-Instruct**:
- Hash (~0.05), Star (~0.03), Whitespace (~0.02) → Total ~0.10
#### Layer 16
- **Qwen-Phys**:
- Hash (~0.01), Star (~0.06), Whitespace (~0.01) → Total ~0.08
- **Qwen-Instruct**:
- Hash (~0.01), Star (~0.02), Whitespace (~0.01) → Total ~0.04
#### Layer 20
- **Qwen-Phys**:
- Hash (~0.03), Star (~0.04), Whitespace (~0.01) → Total ~0.08
- **Qwen-Instruct**:
- Hash (~0.01), Star (~0.01), Whitespace (~0.01) → Total ~0.03
#### Layer 27
- **Qwen-Phys**:
- Hash (~0.01), Star (~0.03), Whitespace (~0.02) → Total ~0.06
- **Qwen-Instruct**:
- Hash (~0.01), Star (~0.02), Whitespace (~0.01) → Total ~0.04
### Key Observations
1. **Layer 0 Dominance**: Both models show near-maximum attention (~0.10) in Layer 0, with Qwen-Phys favoring Star attention and Qwen-Instruct favoring Hash attention.
2. **Layer 16 Shift**: Qwen-Phys allocates ~60% of attention to Star mechanisms, while Qwen-Instruct drops to ~20%.
3. **Layer 20 Drop**: Qwen-Instruct’s total attention plummets to ~0.03, with minimal Hash/Star usage.
4. **Layer 27 Balance**: Qwen-Phys maintains moderate Star attention (~0.03), while Qwen-Instruct shows slight recovery in Hash (~0.02).
### Interpretation
The data reveals distinct layer-wise attention strategies between the models:
- **Qwen-Phys** prioritizes Star attention in early layers (Layer 0, 16) but shifts to balanced Hash/Star usage in later layers (20, 27).
- **Qwen-Instruct** relies heavily on Hash attention in Layer 0 but degrades significantly in later layers, suggesting reduced computational efficiency or focus.
- Whitespace attention remains consistently low (<0.03) across all layers, indicating minimal unused capacity.
These patterns imply that Qwen-Phys may be optimized for sequential processing (Star attention in early layers), while Qwen-Instruct’s Hash-dominated Layer 0 could reflect instruction-specific preprocessing. The sharp drop in Qwen-Instruct’s Layer 20 attention might indicate architectural limitations in deeper layers for instruction-tuned tasks.