## Diagram: Software Compilation Process
### Overview
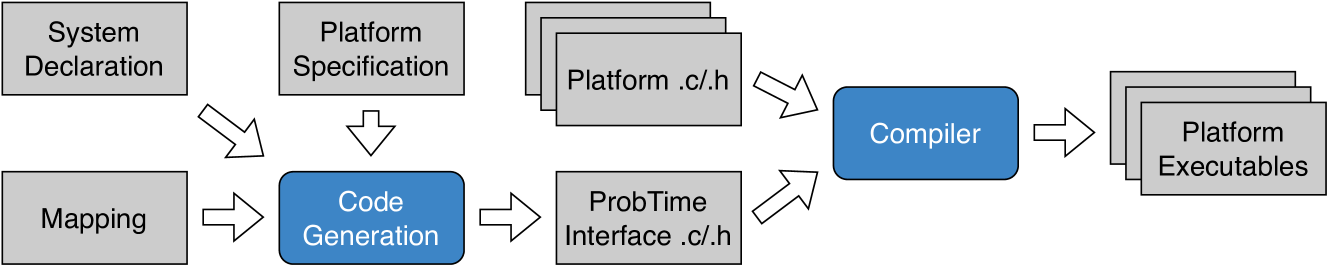
The image is a diagram illustrating a software compilation process. It shows the flow of data and transformations from initial specifications to final executable files. The process involves several stages, including system declaration, platform specification, mapping, code generation, and compilation.
### Components/Axes
The diagram consists of rectangular blocks representing different stages or data types, connected by arrows indicating the flow of information.
* **Blocks (Grey):**
* System Declaration
* Platform Specification
* Mapping
* Platform .c/.h (multiple instances)
* ProbTime Interface .c/.h
* Platform Executables (multiple instances)
* **Blocks (Blue):**
* Code Generation
* Compiler
* **Arrows:** Indicate the direction of data flow between the blocks.
### Detailed Analysis or ### Content Details
1. **System Declaration:** Located at the top-left.
2. **Platform Specification:** Located at the top-center.
3. **Mapping:** Located at the bottom-left, below "System Declaration".
4. **Code Generation:** Located at the bottom-center, below "Platform Specification" and to the right of "Mapping". This block is blue.
5. **Platform .c/.h:** Located at the top-right, multiple instances stacked.
6. **ProbTime Interface .c/.h:** Located at the bottom-right, to the right of "Code Generation".
7. **Compiler:** Located in the center-right, to the right of "Platform .c/.h" and "ProbTime Interface .c/.h". This block is blue.
8. **Platform Executables:** Located at the far-right, multiple instances stacked.
The arrows indicate the following flow:
* System Declaration -> Code Generation
* Platform Specification -> Code Generation
* Mapping -> Code Generation
* Code Generation -> Compiler
* Platform .c/.h -> Compiler
* ProbTime Interface .c/.h -> Compiler
* Compiler -> Platform Executables
### Key Observations
* The diagram illustrates a sequential process, with data flowing from left to right.
* The "Code Generation" and "Compiler" stages are highlighted in blue, possibly indicating key processing steps.
* The diagram shows multiple instances of "Platform .c/.h" and "Platform Executables", suggesting that these are collections of files.
### Interpretation
The diagram represents a typical software compilation process. It starts with high-level specifications (System Declaration, Platform Specification) and mapping information. These inputs are used to generate code, which is then compiled along with platform-specific and interface files to produce executable files. The use of blue for "Code Generation" and "Compiler" suggests these are the core transformation steps in the process. The multiple instances of "Platform .c/.h" and "Platform Executables" indicate that the compilation process may generate multiple output files for different platforms or components.