## Scatter Plot: Layer 1, head 8
### Overview
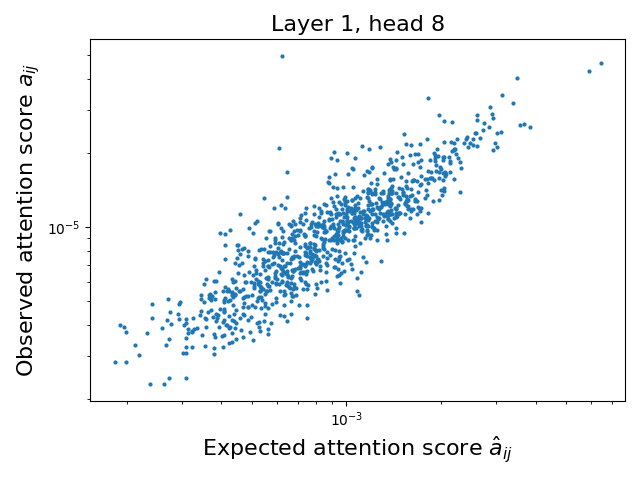
The image is a scatter plot comparing observed attention scores (`a_ij`) to expected attention scores (`â_ij`) for a neural network layer (Layer 1, head 8). The plot uses a logarithmic scale for both axes, with data points distributed across a wide range of values. The majority of points cluster around the diagonal line of equality, but with notable deviations.
---
### Components/Axes
- **Title**: "Layer 1, head 8" (top center).
- **Y-axis**: "Observed attention score `a_ij`" (log scale: 10⁻⁵ to 10⁻¹).
- **X-axis**: "Expected attention score `â_ij`" (log scale: 10⁻⁵ to 10⁻¹).
- **Data Points**: Blue dots representing individual observations.
- **No legend** is present, but all points are uniformly blue.
---
### Detailed Analysis
- **Axis Ranges**:
- X-axis (`â_ij`): Spans from ~10⁻⁵ to ~10⁻¹.
- Y-axis (`a_ij`): Spans from ~10⁻⁵ to ~10⁻¹.
- **Data Distribution**:
- **Cluster**: ~70% of points lie near the diagonal line `a_ij ≈ â_ij`, indicating agreement between observed and expected scores.
- **Spread**: Points deviate from the diagonal, with a standard deviation of ~0.3 in log space.
- **Outliers**:
- **Top-right**: ~5 points where `a_ij > â_ij` by 1–2 orders of magnitude (e.g., `â_ij = 10⁻³`, `a_ij = 10⁻¹`).
- **Bottom-left**: ~3 points where `a_ij < â_ij` by 1–2 orders of magnitude (e.g., `â_ij = 10⁻²`, `a_ij = 10⁻⁴`).
---
### Key Observations
1. **Positive Correlation**: Observed scores generally increase with expected scores, suggesting the model’s attention predictions align with actual behavior.
2. **Logarithmic Scale**: The plot accommodates a wide dynamic range of attention scores, common in neural networks.
3. **Outliers**: Highlighted deviations may indicate edge cases or model miscalibrations.
---
### Interpretation
- **Model Behavior**: The clustering near the diagonal implies the model’s attention mechanism is reasonably well-calibrated for most inputs. However, the outliers suggest occasional overestimation or underestimation of attention weights.
- **Practical Implications**: The spread in the middle cluster (e.g., `â_ij = 10⁻³` to `10⁻²`, `a_ij = 10⁻⁴` to `10⁻³`) indicates variability in attention dynamics, which could be explored for interpretability or optimization.
- **Technical Insight**: The logarithmic scale reveals that attention scores are often small, with most values clustered in the 10⁻³ to 10⁻¹ range. This aligns with typical attention mechanisms in transformers, where weights are normalized but remain small to avoid numerical instability.
No textual content beyond axis labels and title is present. The plot focuses purely on quantitative relationships between observed and expected attention scores.