## Heatmap: Frequency-Time Analysis Across Signal Processing Methods
### Overview
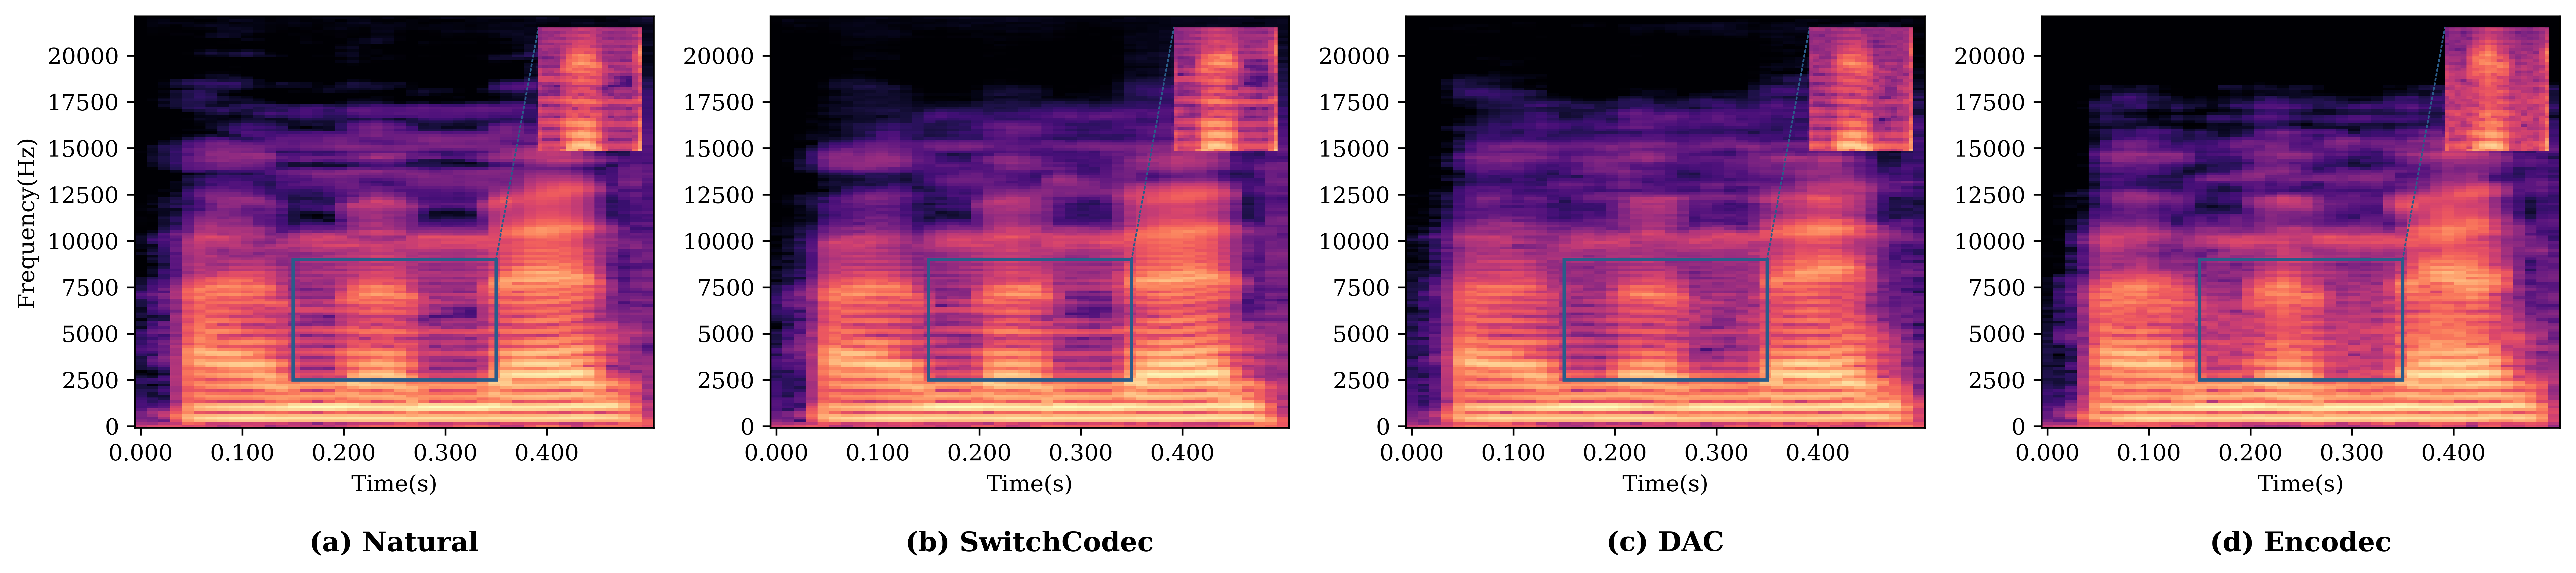
The image presents a comparative heatmap analysis of frequency distributions over time for four signal processing scenarios: Natural, SwitchCodec, DAC, and Encodec. Each panel uses a color gradient (dark purple to yellow) to represent intensity, with a blue box highlighting a specific time-frequency region (0.1-0.4s, 5000-7500Hz) for detailed comparison.
### Components/Axes
- **X-axis (Time)**: 0.000–0.400 seconds, linear scale
- **Y-axis (Frequency)**: 0–20,000 Hz, linear scale
- **Color Scale**: Dark purple (low intensity) to yellow (high intensity)
- **Panels**:
- (a) Natural: Baseline signal
- (b) SwitchCodec: Compressed signal
- (c) DAC: Decompressed signal
- (d) Encodec: Hybrid encoding/decoding
- **Inset**: Zoomed view of the blue-boxed region (0.1–0.4s, 5000-7500Hz)
### Detailed Analysis
1. **Natural (a)**:
- Smooth gradient from dark purple (low) to yellow (high) across all frequencies.
- No abrupt transitions; represents unprocessed signal characteristics.
2. **SwitchCodec (b)**:
- Blocky patterns in mid-frequency ranges (5000–15,000Hz).
- Reduced intensity in the highlighted region compared to Natural.
- Inset shows fragmented yellow patches, suggesting compression artifacts.
3. **DAC (c)**:
- Uniform yellow distribution in the highlighted region.
- Smoother transitions than SwitchCodec but less detailed than Natural.
- Inset reveals consistent intensity across the zoomed region.
4. **Encodec (d)**:
- Hybrid pattern: Blocky mid-frequencies with smoother high/low ranges.
- Highlighted region shows mixed intensity (yellow/purple), indicating partial reconstruction.
- Inset displays granular yellow areas, suggesting residual artifacts.
### Key Observations
- **Artifact Patterns**: SwitchCodec introduces blocky distortions in mid-frequencies, while Encodec shows a mix of artifacts and smoother regions.
- **Frequency Preservation**: Natural retains full frequency detail; DAC partially restores it, and Encodec shows intermediate recovery.
- **Time-Frequency Localization**: The blue-boxed region (0.1–0.4s, 5000-7500Hz) is critical for comparing compression/decompression fidelity.
### Interpretation
The data demonstrates how encoding methods alter frequency-time relationships:
- **Natural** serves as a reference for unprocessed signal integrity.
- **SwitchCodec** prioritizes compression efficiency at the cost of mid-frequency detail, evident in the blocky patterns.
- **DAC** partially restores the signal but lacks the granularity of the original.
- **Encodec** balances compression and reconstruction, retaining some mid-frequency structure while smoothing extremes.
The highlighted regions emphasize trade-offs: SwitchCodec sacrifices detail for efficiency, DAC recovers broadly but imprecisely, and Encodec offers a middle ground. These patterns align with expectations for lossy compression artifacts and hybrid encoding strategies.