\n
## Diagram: Symbolic Generation & LLM Formalization
### Overview
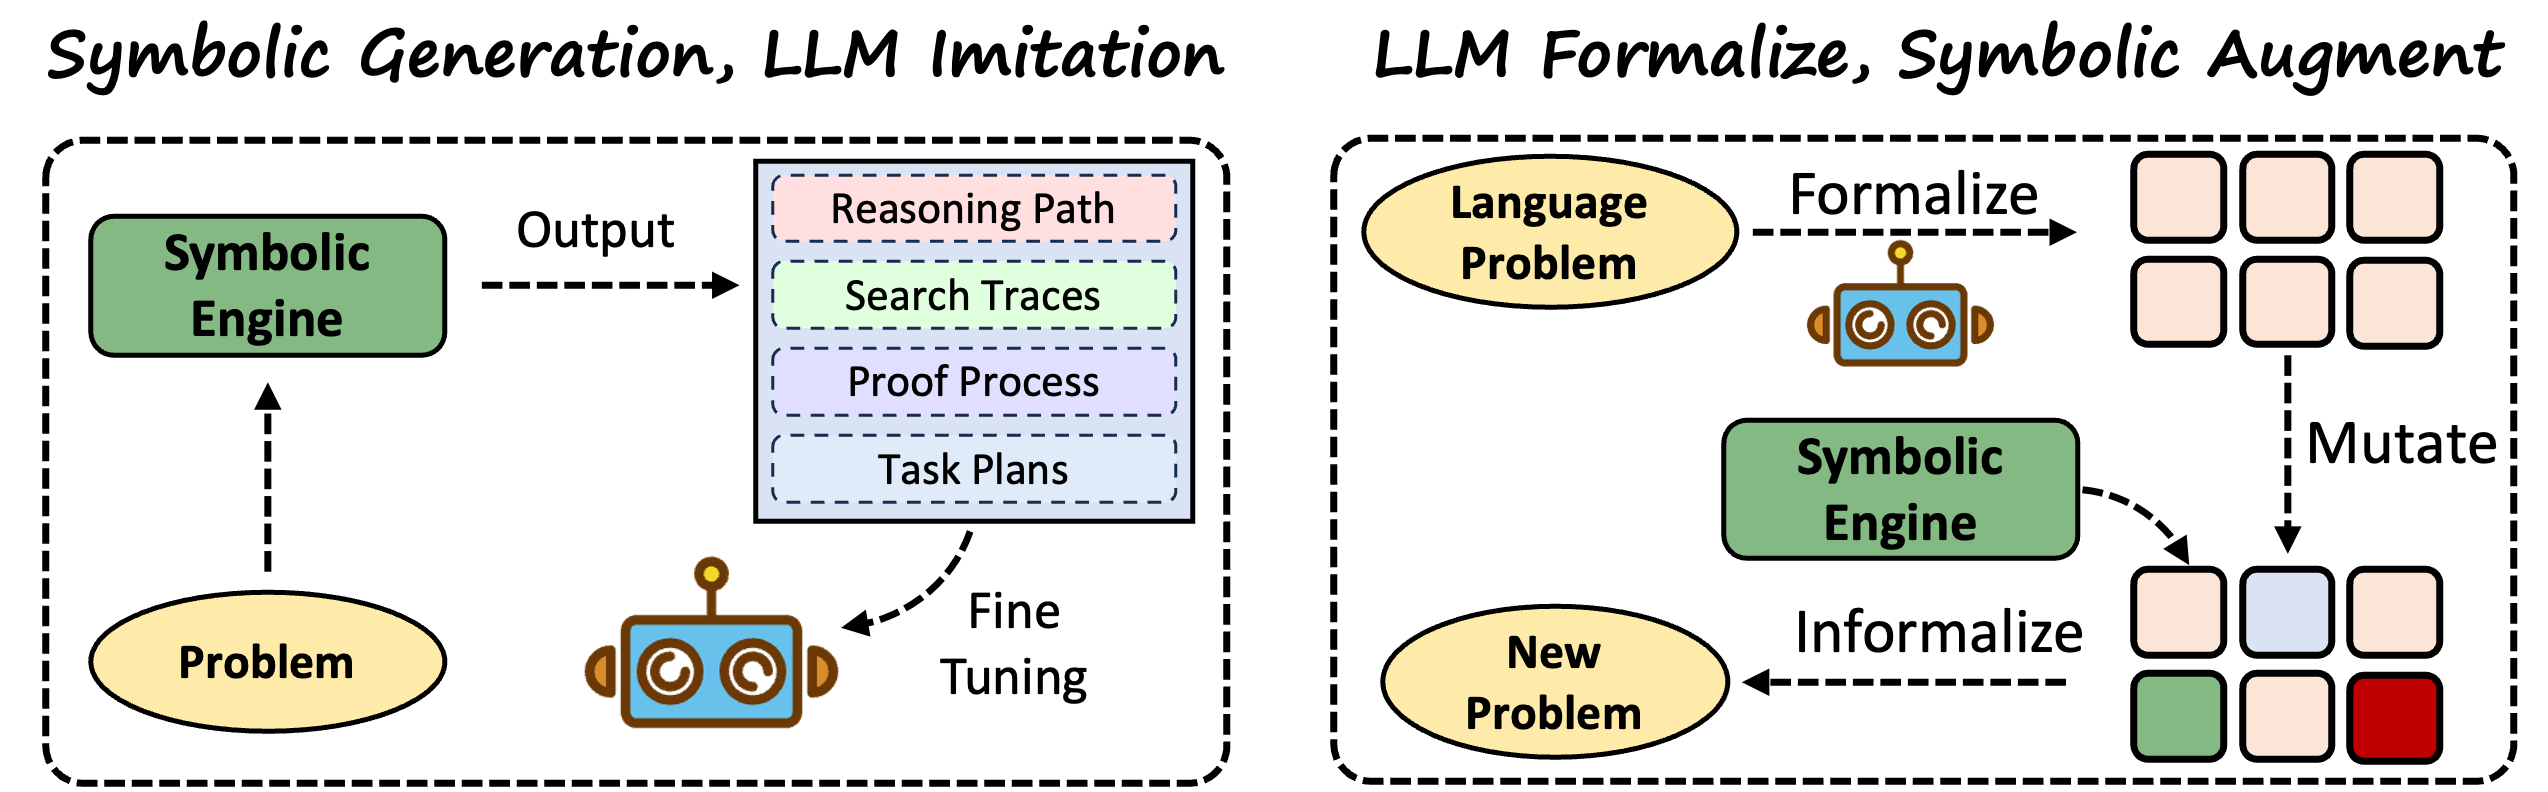
The image presents a diagram illustrating two distinct approaches to problem-solving: "Symbolic Generation, LLM Imitation" and "LLM Formalize, Symbolic Augment". Both approaches involve a "Symbolic Engine" and a "Problem" component, but differ in how they interact and utilize a Large Language Model (LLM), represented by a set of colored circles. The diagram uses boxes, ovals, and arrows to depict the flow of information and processes.
### Components/Axes
The diagram is divided into two main sections, separated by a vertical dashed line. Each section contains the following components:
* **Symbolic Engine:** Represented by a green rectangle.
* **Problem:** Represented by a yellow oval.
* **LLM:** Represented by a cluster of colored circles (orange, blue, purple).
* **Output/Formalize/Informalize:** Text labels indicating the type of transformation.
* **Reasoning Path/Search Traces/Proof Process/Task Plans:** Text labels within a dashed box, representing different outputs from the Symbolic Engine.
* **Mutate:** Text label indicating a transformation process.
* **New Problem:** Represented by a yellow oval.
* **Boxes:** Representing intermediate states or results.
* **Arrows:** Indicating the direction of information flow.
### Detailed Analysis or Content Details
**Left Side: Symbolic Generation, LLM Imitation**
1. **Problem** (yellow oval) feeds into the **Symbolic Engine** (green rectangle).
2. The **Symbolic Engine** generates **Output** (text label).
3. The **Output** is further categorized into four components within a dashed box:
* **Reasoning Path**
* **Search Traces**
* **Proof Process**
* **Task Plans**
4. The **LLM** (orange, blue, purple circles) receives input from the **Symbolic Engine** and is used for **Fine Tuning**.
5. The **Fine Tuning** process feeds back into the **Problem** component.
**Right Side: LLM Formalize, Symbolic Augment**
1. A **Language Problem** (oval) is **Formalized** (text label) and sent to the **Symbolic Engine** (green rectangle). The Formalization step is linked to the LLM (orange, blue, purple circles).
2. The **Symbolic Engine** generates a series of boxes, representing intermediate states.
3. These boxes are then **Mutated** (text label).
4. The **Symbolic Engine** then **Informalizes** (text label) the mutated output, resulting in a **New Problem** (yellow oval).
**LLM Representation:** The LLM is consistently represented by a cluster of three circles: orange, blue, and purple. The order appears consistent across both sides of the diagram.
### Key Observations
* The diagram highlights a cyclical process in both approaches.
* The LLM plays different roles in each approach: imitation/fine-tuning versus formalization/augmentation.
* The left side focuses on generating outputs from symbolic reasoning, while the right side focuses on transforming problems using symbolic reasoning guided by LLM formalization.
* The diagram does not provide any quantitative data or numerical values. It is a conceptual illustration of processes.
### Interpretation
The diagram illustrates two contrasting strategies for integrating symbolic reasoning with Large Language Models. The "Symbolic Generation, LLM Imitation" approach uses the LLM to learn from the outputs of a symbolic engine, essentially mimicking its reasoning process through fine-tuning. This suggests a focus on improving the LLM's ability to *act* like a symbolic reasoner.
The "LLM Formalize, Symbolic Augment" approach leverages the LLM to translate natural language problems into a symbolic representation that can be processed by the symbolic engine. This suggests a focus on using the LLM to *enable* symbolic reasoning by providing a structured input. The subsequent mutation and informalization steps indicate a process of exploring the solution space and generating new problems.
The diagram implies that both approaches are iterative, with feedback loops that refine the problem or the LLM's behavior. The use of dashed lines and boxes suggests that certain processes are internal or represent intermediate states rather than concrete outputs. The diagram is a high-level conceptual overview and does not delve into the specific algorithms or techniques used in each approach.