## Diagram: Foundation Model Data Flow and Applications
### Overview
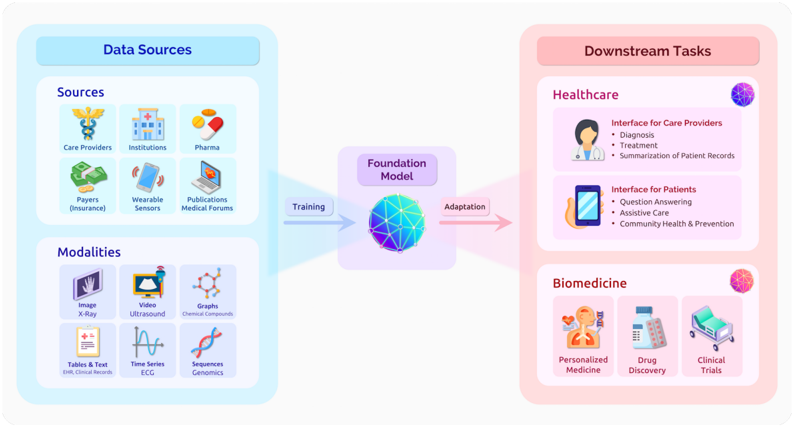
This image is a system architecture diagram illustrating the flow of multimodal data from various sources through a central "Foundation Model" for training and adaptation, ultimately serving diverse downstream tasks in healthcare and biomedicine. The diagram is organized into three primary vertical sections: Data Sources (left), Foundation Model (center), and Downstream Tasks (right).
### Components/Axes
The diagram is segmented into three main regions:
1. **Left Region: Data Sources** (Light blue container)
* **Header:** "Data Sources"
* **Sub-section 1: "Sources"** (Top-left quadrant)
* Contains six icons with labels:
* Care Providers
* Institutions
* Pharma
* Payers (Insurance)
* Wearable Sensors
* Publications / Medical Forums
* **Sub-section 2: "Modalities"** (Bottom-left quadrant)
* Contains six icons with labels and sub-labels:
* Image (X-Ray)
* Video (Ultrasound)
* Graphs (Chemical Compounds)
* Tables & Text (EMR, Clinical Records)
* Time Series (ECG)
* Sequences (Genomics)
2. **Center Region: Foundation Model** (Purple container)
* **Central Node:** A purple box labeled "Foundation Model" containing a colorful, geometric sphere icon.
* **Flow Arrows:**
* A blue arrow labeled "Training" points from the "Data Sources" region to the "Foundation Model".
* A pink arrow labeled "Adaptation" points from the "Foundation Model" to the "Downstream Tasks" region.
3. **Right Region: Downstream Tasks** (Pink container)
* **Header:** "Downstream Tasks"
* **Sub-section 1: "Healthcare"** (Top-right quadrant)
* **Interface for Care Providers** (Icon of a doctor)
* Bullet points: Diagnosis, Treatment, Summarization of Patient Records
* **Interface for Patients** (Icon of a hand holding a smartphone)
* Bullet points: Question Answering, Assistive Care, Community Health & Prevention
* **Sub-section 2: "Biomedicine"** (Bottom-right quadrant)
* Contains three icons with labels:
* Personalized Medicine
* Drug Discovery
* Clinical Trials
### Detailed Analysis
The diagram presents a clear, linear workflow:
1. **Input:** Multimodal data (images, video, text, etc.) is sourced from various entities in the healthcare ecosystem (providers, pharma, wearables, etc.).
2. **Processing:** This diverse data is used for the "Training" of a central "Foundation Model".
3. **Output/Adaptation:** The trained model undergoes "Adaptation" to power specific applications.
4. **Applications:** These applications are categorized into two main domains:
* **Healthcare:** Focused on interfaces for both care providers (clinical tasks) and patients (consumer health).
* **Biomedicine:** Focused on research and development tasks like drug discovery and clinical trials.
### Key Observations
* **Multimodality is Central:** The "Modalities" section explicitly lists six different data types, emphasizing that the foundation model is designed to process heterogeneous information.
* **Bidirectional Ecosystem:** While the primary flow is left-to-right, the "Sources" include both data generators (Care Providers, Wearable Sensors) and data aggregators/intermediaries (Payers, Publications), depicting a complex data ecosystem.
* **Clear Separation of Concerns:** The diagram cleanly separates the *training data domain* (left), the *core model* (center), and the *application domains* (right). Within applications, it further separates clinical care (Healthcare) from research (Biomedicine).
* **User-Centric Design:** The "Healthcare" section explicitly defines interfaces for two distinct user groups: care providers and patients, indicating a focus on usability and specific needs.
### Interpretation
This diagram illustrates a paradigm for leveraging AI in medicine. It suggests that a single, powerful foundation model, trained on a wide array of multimodal medical data, can be a versatile engine. This engine can then be efficiently adapted or fine-tuned for a broad spectrum of specific, high-value tasks, ranging from direct patient care and clinical decision support to accelerating biomedical research.
The structure implies that the complexity and heterogeneity of medical data (the left side) are unified and managed by the foundation model, which then provides a simplified, adaptable interface for building targeted solutions (the right side). This approach aims to overcome the challenge of building separate, siloed AI tools for each medical sub-task. The inclusion of both "Care Providers" and "Patients" as interfaces highlights a vision where AI supports the entire healthcare continuum, from professional diagnosis to personal health management.