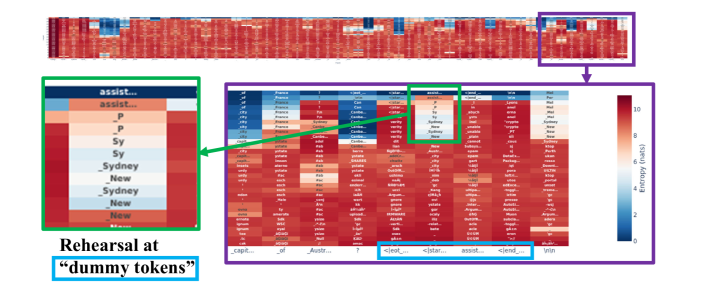
## Heatmap: Entropy of Token Predictions
### Overview
The image presents a heatmap visualizing the entropy of token predictions in a language model, likely during a rehearsal or fine-tuning process. The heatmap displays the entropy values for different tokens at various positions in the input sequence. The color gradient represents the entropy, with blue indicating low entropy (high confidence) and red indicating high entropy (low confidence). The image highlights specific regions of interest, including the entropy values associated with "dummy tokens" during rehearsal.
### Components/Axes
* **X-axis:** Represents the position or type of token in the input sequence. The labels along the x-axis are truncated, but some visible examples include "_capit...", "_of", "Austr...", "?", "<leot...", "</star...", "assist...", "<lend...", and "Inin".
* **Y-axis:** Represents the predicted tokens. The labels along the y-axis are also truncated, but examples include "_of", "city", "potato", "ty", "ignure", "inter", "Argum", "assist...", "P", "Sy", "Sydney", "New".
* **Color Scale (Legend):** Located on the right side of the heatmap. It indicates the entropy values corresponding to the colors in the heatmap. Blue represents low entropy (0-2 nats), and red represents high entropy (8-10 nats). The scale is labeled "Entropy (nats)".
### Detailed Analysis
**1. Overall Heatmap:**
* The top portion of the image shows a broad overview of the entropy across a larger sequence. There are distinct vertical bands of high and low entropy, suggesting that certain positions in the sequence consistently lead to more or less predictable token predictions.
* A purple box highlights a section of the heatmap for closer inspection.
**2. Detailed Heatmap (Purple Box):**
* This section provides a more granular view of the entropy values for specific token predictions.
* The rows represent the predicted tokens, and the columns represent the context or position in the sequence.
* The color intensity indicates the entropy associated with each prediction.
**3. "Dummy Tokens" Rehearsal (Green Box):**
* A green box highlights a specific region of the heatmap related to "dummy tokens".
* The y-axis labels in this region include "assist...", "P", "Sy", "Sydney", and "New".
* The entropy values in this region vary, with some predictions showing low entropy (blue) and others showing high entropy (red).
**4. Specific Token Analysis:**
* **assist...:** The entropy for predicting "assist..." varies depending on the context. In some positions, it has low entropy (blue), while in others, it has high entropy (red).
* **P:** Similar to "assist...", the entropy for predicting "P" varies.
* **Sy:** The entropy for predicting "Sy" also varies.
* **Sydney:** The entropy for predicting "Sydney" also varies.
* **New:** The entropy for predicting "New" also varies.
**5. X-Axis Token Analysis:**
* **_capit...:** This token seems to have a mix of high and low entropy predictions across different predicted tokens.
* **_of:** This token also shows a mix of high and low entropy predictions.
* **Austr...:** Similar to the previous tokens, "Austr..." has varying entropy.
* **<leot...:** This token appears to have generally low entropy predictions (blue).
* **</star...:** This token also appears to have generally low entropy predictions (blue).
* **assist...:** This token shows a mix of high and low entropy predictions.
* **<lend...:** This token appears to have generally low entropy predictions (blue).
* **Inin:** This token shows a mix of high and low entropy predictions.
### Key Observations
* The entropy of token predictions varies significantly depending on the context and the specific token being predicted.
* "Dummy tokens" during rehearsal exhibit a range of entropy values, suggesting that the model's confidence in predicting these tokens varies.
* The heatmap reveals patterns in the model's uncertainty, with certain positions in the sequence consistently leading to higher or lower entropy predictions.
* The tokens "<leot...", "</star...", and "<lend..." seem to have consistently low entropy, indicating high confidence in their predictions.
### Interpretation
The heatmap provides insights into the language model's behavior during rehearsal with "dummy tokens." The varying entropy values suggest that the model is learning to predict these tokens with different levels of confidence depending on the context. The patterns in the heatmap can help identify areas where the model struggles to make accurate predictions and guide further training or fine-tuning efforts. The low entropy associated with "<leot...", "</star...", and "<lend..." might indicate that these tokens are easily predictable in the given context, possibly due to their role as delimiters or markers in the sequence. The high entropy values for other tokens suggest that the model is less certain about their predictions, potentially due to ambiguity or lack of sufficient training data.