# Technical Document Extraction: Entropy Heatmap Analysis
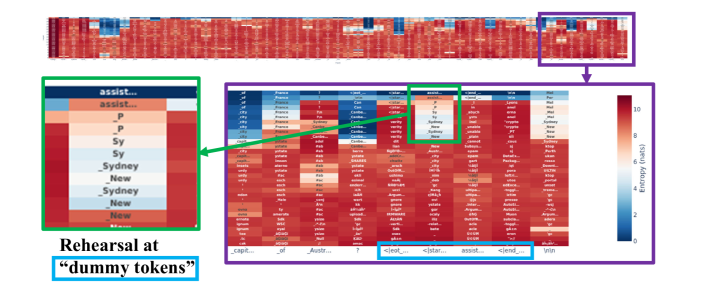
This document provides a detailed technical extraction of the provided image, which illustrates entropy levels across various tokens in a machine learning context, specifically highlighting "rehearsal at dummy tokens."
## 1. Image Overview and Segmentation
The image is a composite visualization consisting of three primary regions:
* **Region A (Top):** A wide, low-resolution overview heatmap showing a long sequence of data points.
* **Region B (Center-Right):** A purple-bordered magnification of the tail end of the overview heatmap, providing legible token labels and entropy values.
* **Region C (Left):** A green-bordered high-magnification "zoom-in" of a specific vertical column from Region B, emphasizing a repetitive pattern.
## 2. Legend and Scale
* **Location:** Right side of Region B.
* **Type:** Vertical color gradient bar.
* **Label:** "Entropy (nats)"
* **Scale Range:** 0 to 10.
* **Color Mapping:**
* **Dark Blue (0-2 nats):** Low entropy (high predictability/certainty).
* **White/Light Blue (4-6 nats):** Moderate entropy.
* **Red/Dark Red (8-10+ nats):** High entropy (low predictability/uncertainty).
## 3. Data Table Extraction (Region B - Magnified Heatmap)
This region displays a grid where the x-axis represents specific context or sequence positions, and the y-axis represents tokens.
### X-Axis Labels (Bottom Row)
From left to right, the visible labels are:
1. `_capit...`
2. `_of`
3. `_Austr...`
4. `?`
5. `<|eot_...` (Highlighted in a blue box)
6. `<|star...` (Highlighted in a blue box)
7. `assist...` (Highlighted in a blue box)
8. `<|end_...` (Highlighted in a blue box)
9. `\n\n`
### Y-Axis Tokens (Sampled from Grid)
The grid contains various tokens including:
* **Geographic/Proper Nouns:** `_France`, `_Sydney`, `_New`, `Canberra`, `Perth`, `Lyon`.
* **Functional/Structural:** `_of`, `_city`, `_capit...`, `assist...`, `_is`.
* **Special Tokens:** `<|star...`, `<|end_...`.
### Trend Observation
The heatmap is predominantly **Dark Red**, indicating high entropy (uncertainty) for most tokens across the sequence. However, distinct **Blue/White vertical columns** appear at specific intervals, indicating localized drops in entropy where the model becomes highly certain of the next token.
## 4. Component Isolation: "Rehearsal at dummy tokens"
The image specifically highlights a phenomenon labeled **"Rehearsal at 'dummy tokens'"**.
### The Green Zoom-In (Region C)
This section focuses on the column corresponding to the `assist...` x-axis label.
* **Visual Trend:** The column shows a repeating vertical pattern of low-entropy (blue/white) tokens amidst a high-entropy (red) background.
* **Transcribed Tokens (Top to Bottom):**
| Token | Entropy Level |
| :--- | :--- |
| `assist...` | Dark Blue (Low Entropy) |
| `assist...` | Light Orange (Moderate Entropy) |
| `_P` | White/Light Blue |
| `_P` | White/Light Blue |
| `Sy` | White/Light Blue |
| `Sy` | White/Light Blue |
| `_Sydney` | White/Light Blue |
| `_New` | White/Light Blue |
| `_Sydney` | White/Light Blue |
| `_New` | White/Light Blue |
### Analysis of the Blue Box (X-Axis)
The blue box highlights a specific sequence of tokens:
`[<|eot_... , <|star... , assist... , <|end_...]`
This sequence appears to be the "dummy tokens" referred to in the caption. The heatmap shows that when these tokens are present, the entropy for specific associated values (like "Sydney" or "New") drops significantly, suggesting the model is "rehearsing" or retrieving these specific facts during these structural token phases.
## 5. Summary of Facts
* **Primary Metric:** Entropy measured in "nats".
* **Key Finding:** Entropy is not uniform; it drops sharply (indicated by blue/white cells) at specific structural markers.
* **Specific Behavior:** The model exhibits a "rehearsal" pattern where geographic tokens (`Sydney`, `New`) show lower entropy during the processing of assistant-related dummy tokens.