## Heatmap: Rehearsal at "dummy tokens"
### Overview
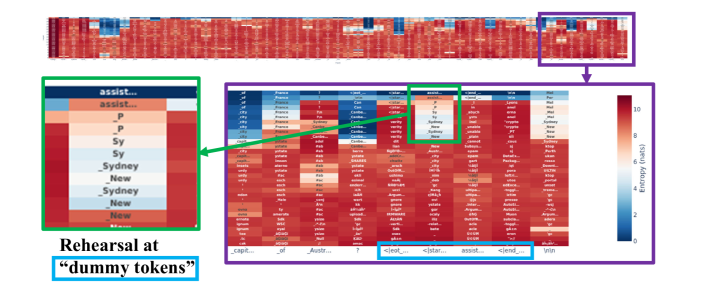
The image displays a heatmap visualizing entropy values across a sequence of tokens, with two insets highlighting specific regions. The main heatmap uses a red-to-blue gradient (0–10 nats entropy) to represent uncertainty, while the insets provide zoomed-in views of critical areas. A table on the left lists token categories, and a color bar on the right quantifies entropy.
### Components/Axes
- **Main Heatmap**:
- **X-axis**: Token categories (e.g., `assist...`, `_P`, `Sy`, `Sydney`, `New`, `dummy tokens`).
- **Y-axis**: Entropy values (0–10 nats, color-coded from blue [low] to red [high]).
- **Legend**: Entropy scale (0–10 nats) with a gradient bar.
- **Insets**:
- **Top-left inset**: Zoomed-in view of the `assist...` and `_P` token regions.
- **Bottom-right inset**: Highlighted area with high entropy (red regions).
- **Table**:
- Columns: `assist...`, `_P`, `Sy`, `Sydney`, `New`, `dummy tokens`.
- Rows: Token counts (e.g., `_Sydney` appears 3 times, `_New` appears 2 times).
### Detailed Analysis
- **Main Heatmap**:
- Dominated by red tones (high entropy) in the middle and right sections.
- Blue regions (low entropy) appear sporadically in the left and top sections.
- The zoomed-in inset reveals a cluster of high-entropy values (red) in the `assist...` and `_P` token regions.
- **Table**:
- `assist...` and `_P` tokens have the highest counts (e.g., `assist...` appears 5 times).
- `Sydney` and `New` tokens appear less frequently (2–3 times each).
- `dummy tokens` are listed but lack explicit counts in the visible portion.
### Key Observations
1. **High Entropy Clusters**: The zoomed-in inset shows a dense red region in the `assist...` and `_P` token areas, suggesting significant uncertainty in these tokens.
2. **Token Frequency**: The table indicates `assist...` and `_P` are the most frequent tokens, while `Sydney` and `New` are less common.
3. **Entropy Gradient**: The main heatmap’s red-to-blue gradient aligns with the legend, confirming high entropy in the right and middle regions.
### Interpretation
The heatmap suggests that the `assist...` and `_P` tokens exhibit the highest uncertainty (entropy) during rehearsal, potentially indicating variability or ambiguity in their usage. The table’s token counts imply these tokens are prioritized or repeated in the dataset. The zoomed-in inset highlights a critical region where entropy peaks, possibly reflecting a point of instability or focus in the model’s training process. The use of `dummy tokens` may relate to data augmentation or placeholder strategies, though their exact role is unclear without additional context.
**Note**: Approximate values (e.g., token counts) are inferred from visible patterns, as exact numerical labels are not fully legible.