## Venn Diagram: Screen Usage and Impact
### Overview
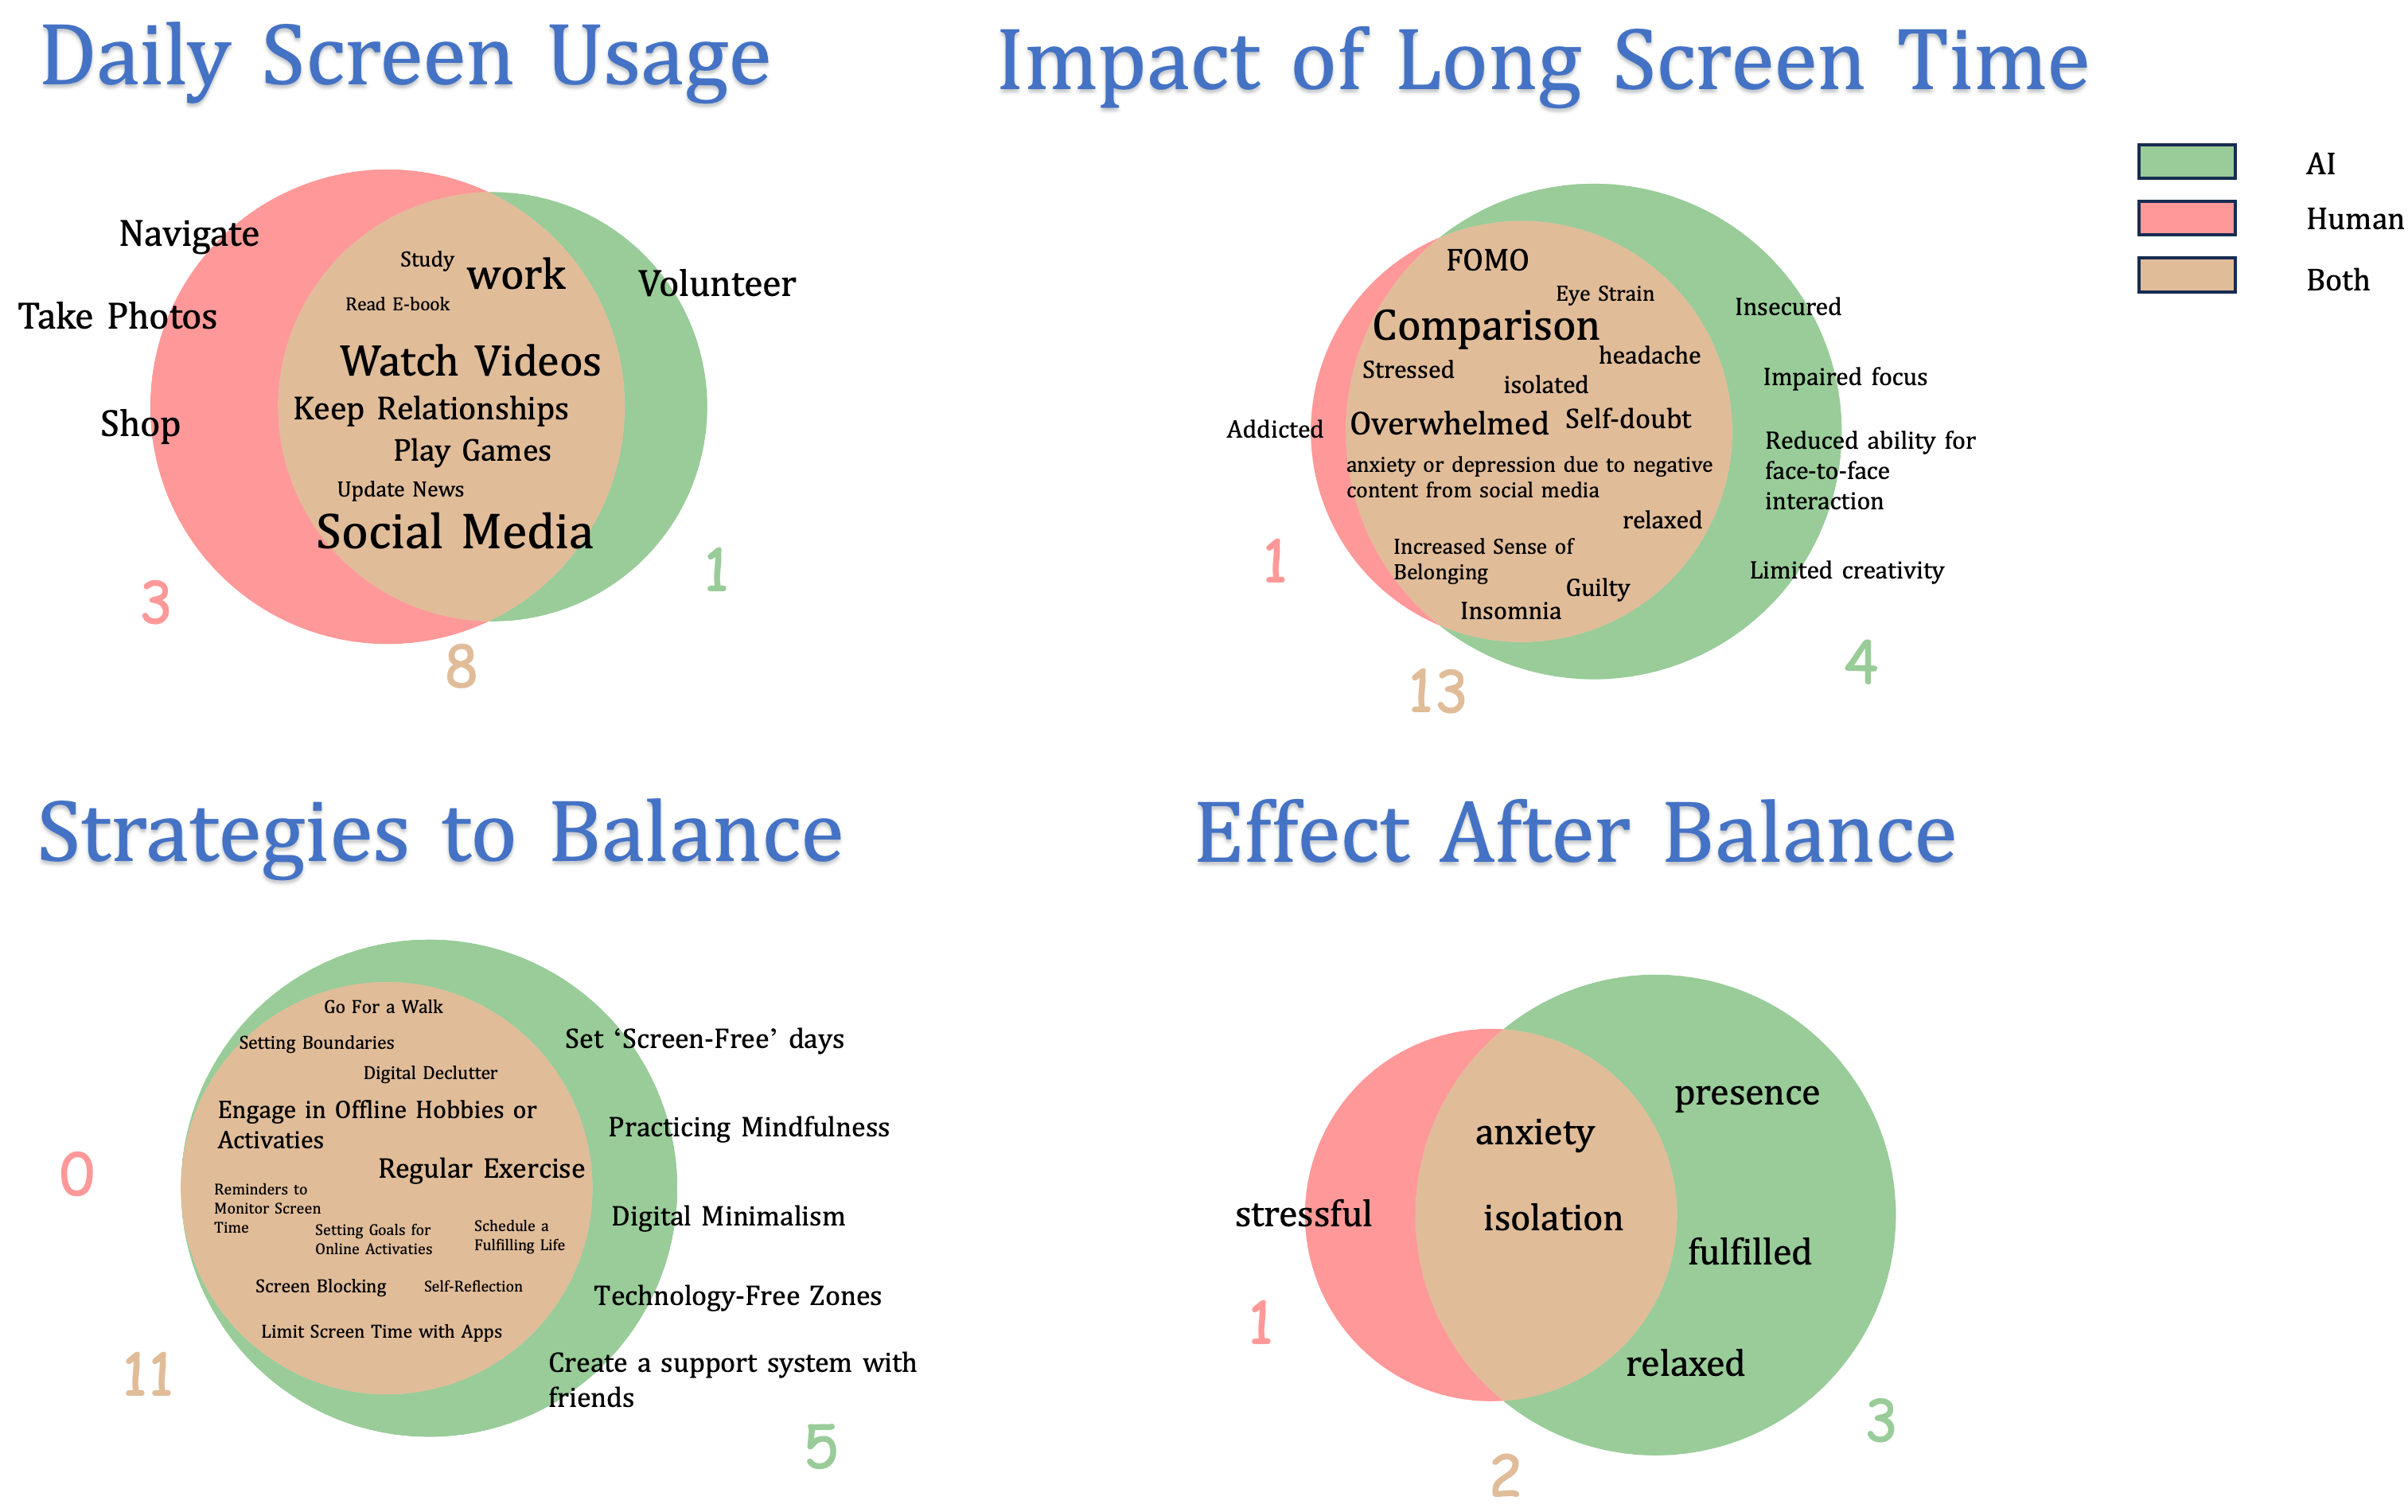
The image presents a series of Venn diagrams illustrating various aspects of screen usage, its impacts, strategies for balance, and the effects of balance. Each diagram uses overlapping circles to represent different categories (AI, Human, Both) and their intersections. The diagrams are titled "Daily Screen Usage," "Impact of Long Screen Time," "Strategies to Balance," and "Effect After Balance."
### Components/Axes
* **Titles:** "Daily Screen Usage," "Impact of Long Screen Time," "Strategies to Balance," "Effect After Balance"
* **Circles:** Represented by three colors:
* Green: AI
* Red: Human
* Tan: Both
* **Labels within Circles:** Describe activities, impacts, strategies, or effects.
* **Numbers:** Indicate the number of items/activities/effects associated with each section of the Venn diagram.
* **Legend:** Located in the top-right corner, indicating the color-coding for AI (green), Human (red), and Both (tan).
### Detailed Analysis
**1. Daily Screen Usage**
* **Human (Red):**
* Navigate (3)
* Take Photos
* Shop
* **AI (Green):**
* Volunteer (1)
* **Both (Tan):**
* Study (8)
* Work
* Read E-book
* Watch Videos
* Keep Relationships
* Play Games
* Update News
* Social Media
**2. Impact of Long Screen Time**
* **Human (Red):**
* Addicted (1)
* **AI (Green):**
* Insecured (4)
* Eye Strain
* Headache
* Impaired focus
* Reduced ability for face-to-face interaction
* Limited creativity
* **Both (Tan):**
* FOMO (13)
* Comparison
* Stressed
* Isolated
* Overwhelmed
* Self-doubt
* Anxiety or depression due to negative content from social media
* Relaxed
* Increased Sense of Belonging
* Guilty
* Insomnia
**3. Strategies to Balance**
* **Human (Red):**
* (0)
* **AI (Green):**
* Create a support system with friends (5)
* **Both (Tan):**
* Go For a Walk (11)
* Setting Boundaries
* Digital Declutter
* Engage in Offline Hobbies or Activities
* Reminders to Monitor Screen Time
* Setting Goals for Online Activities
* Schedule a Fulfilling Life
* Screen Blocking
* Self-Reflection
* Limit Screen Time with Apps
* Set 'Screen-Free' days
* Practicing Mindfulness
* Digital Minimalism
* Technology-Free Zones
* Regular Exercise
**4. Effect After Balance**
* **Human (Red):**
* Stressful (1)
* **AI (Green):**
* Presence (3)
* Fulfilled
* Relaxed
* **Both (Tan):**
* Anxiety (2)
* Isolation
### Key Observations
* **Daily Screen Usage:** Most activities fall under the "Both" category, indicating a blend of human interaction and AI assistance.
* **Impact of Long Screen Time:** Negative impacts are spread across all categories, with a significant overlap in the "Both" category.
* **Strategies to Balance:** Most strategies involve a combination of human effort and AI tools.
* **Effect After Balance:** The desired effects (presence, fulfilled, relaxed) are primarily associated with the "AI" category, while negative effects (stressful, anxiety, isolation) are in the "Human" and "Both" categories.
### Interpretation
The Venn diagrams provide a visual representation of the complex relationship between screen usage, its impacts, and strategies for achieving balance. The data suggests that while AI plays a significant role in our daily screen activities, it also contributes to both positive and negative impacts. Balancing screen time involves a combination of human effort and AI tools, with the goal of achieving positive effects such as presence, fulfillment, and relaxation. The overlap between categories highlights the interconnectedness of these factors and the need for a holistic approach to managing screen time. The numbers associated with each section provide a relative measure of the prevalence or importance of each activity, impact, strategy, or effect.