\n
## Network Diagram: Daily Screen Usage, Impact, Strategies & Effects
### Overview
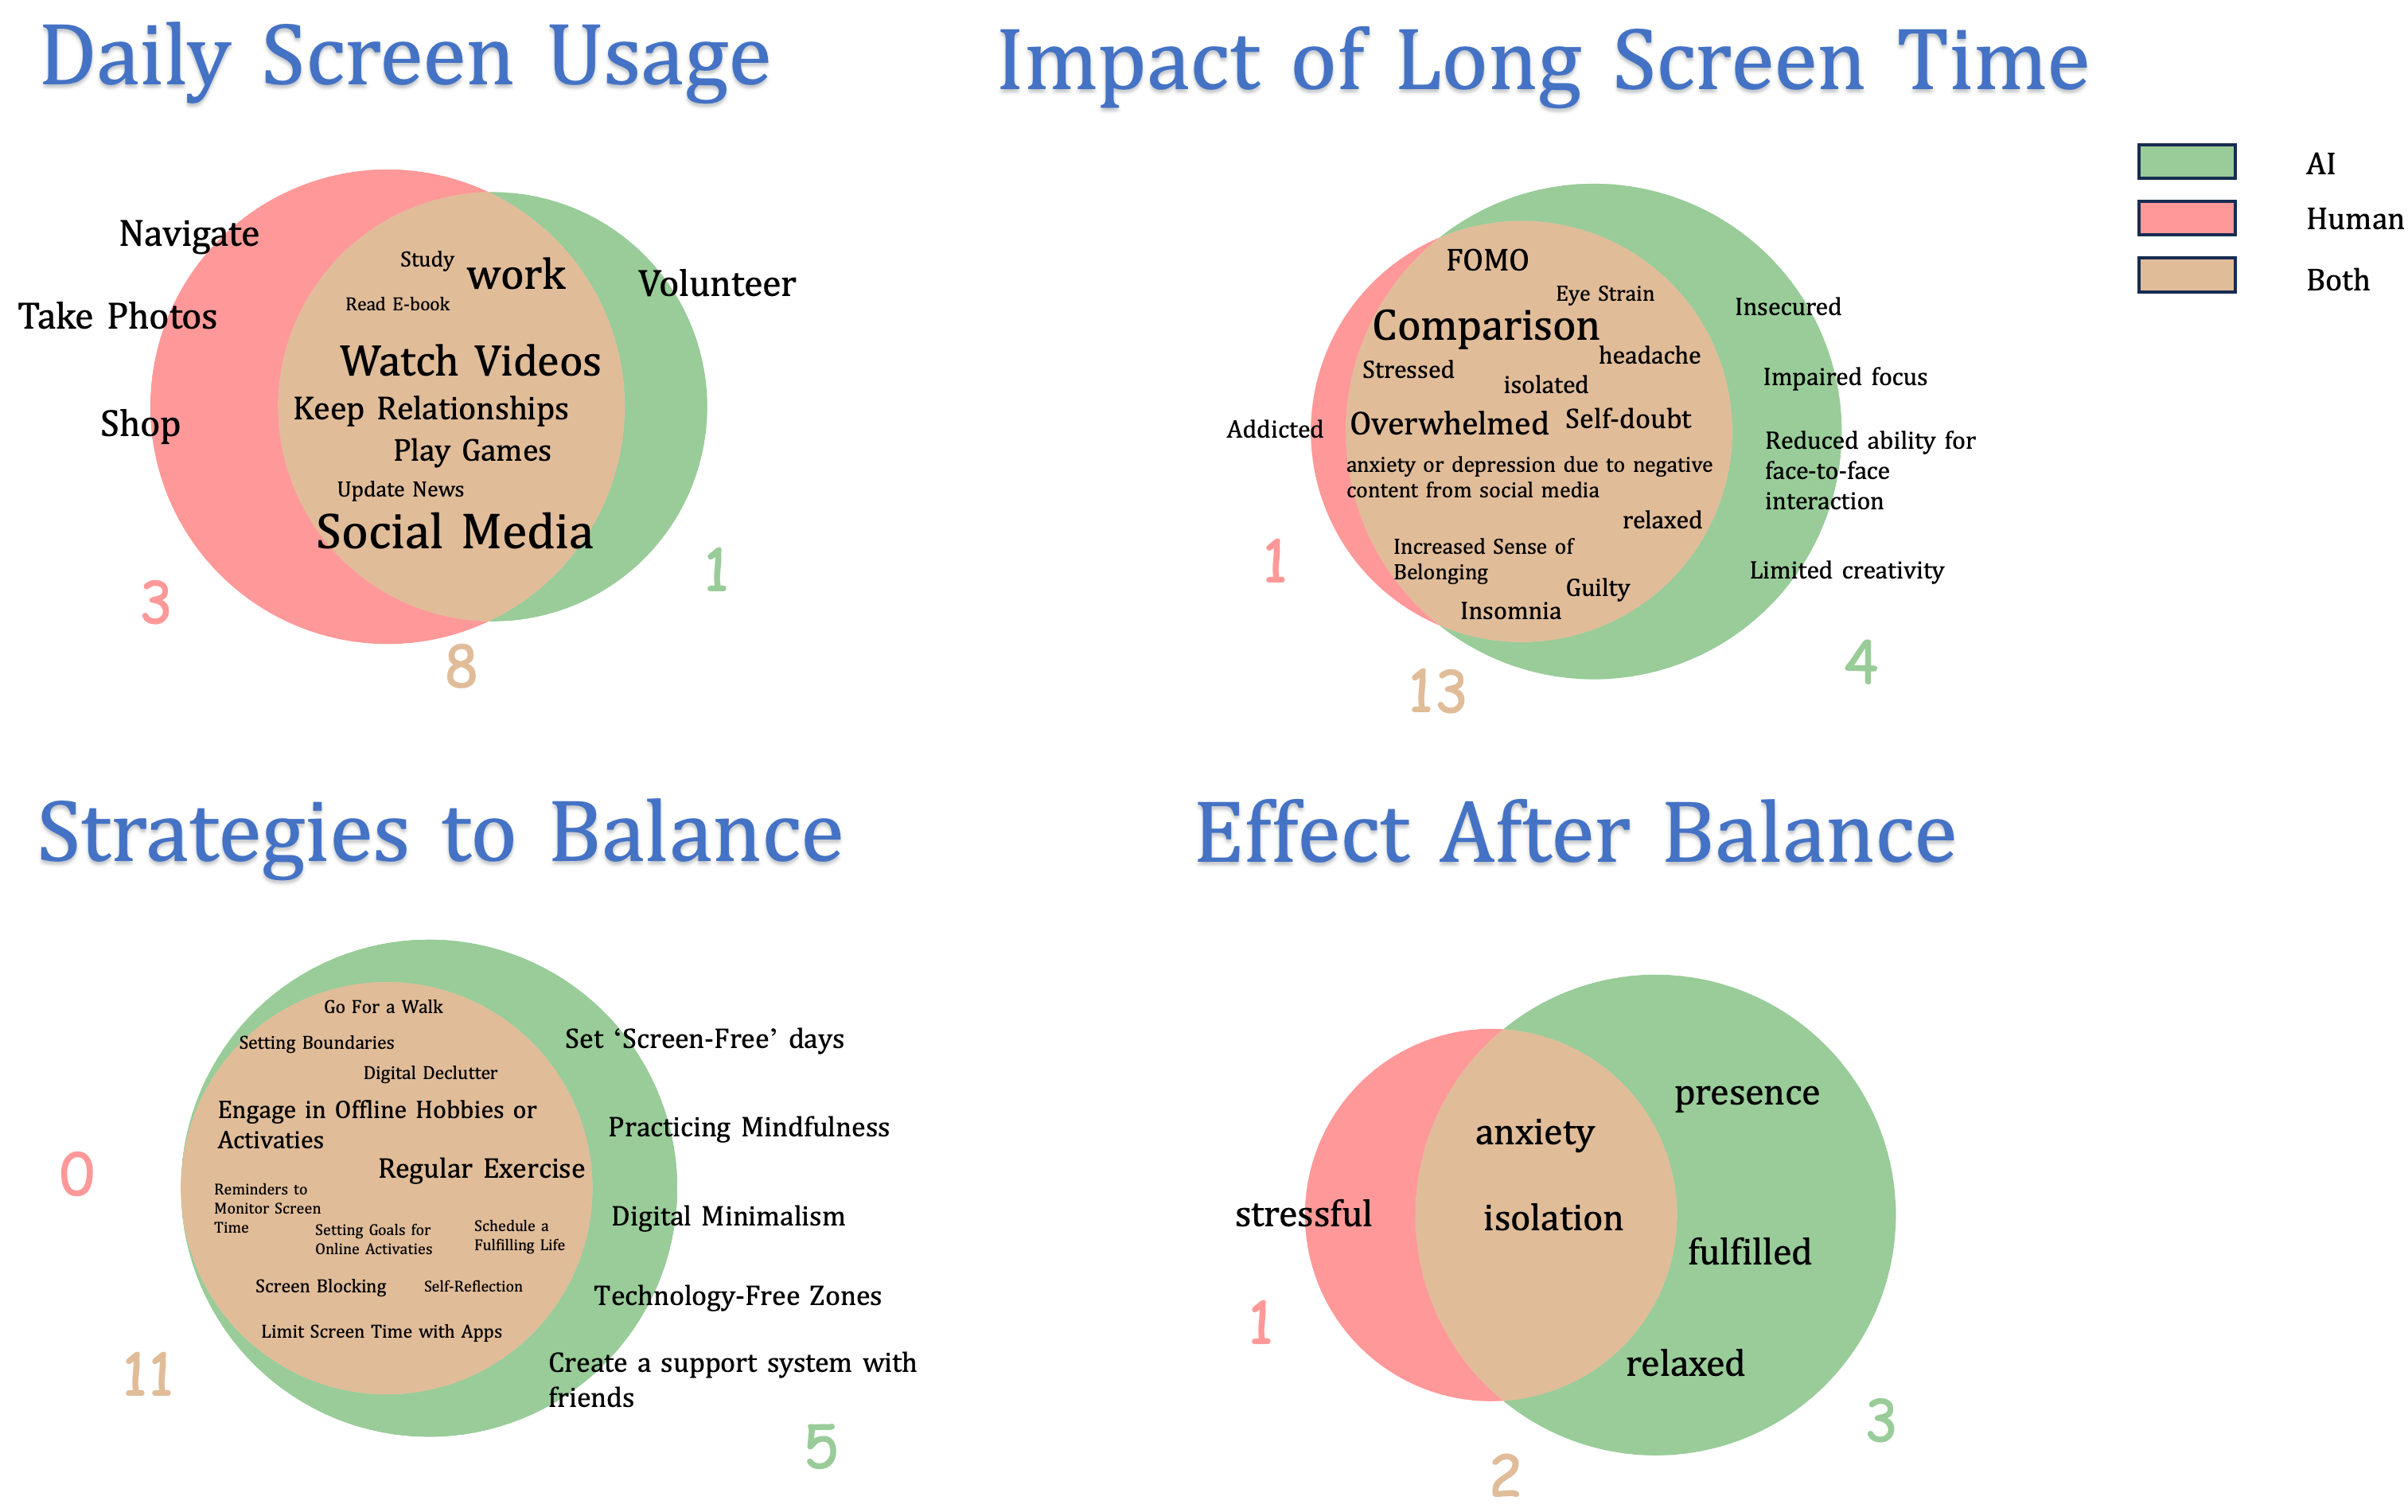
This image presents a network diagram illustrating daily screen usage, the impact of long screen time, strategies to balance screen time, and the effects after achieving balance. The diagram utilizes interconnected nodes and color-coding to represent different categories and their relationships. The diagram is divided into four main sections arranged in a 2x2 grid.
### Components/Axes
The diagram consists of four main sections:
1. **Daily Screen Usage:** A network of activities with node sizes representing usage frequency.
2. **Impact of Long Screen Time:** A network of negative consequences, also with node sizes indicating impact severity.
3. **Strategies to Balance:** A network of strategies to mitigate screen time, with node sizes representing implementation frequency.
4. **Effect After Balance:** A network of positive effects after implementing balance strategies, with node sizes indicating effect strength.
A legend in the top-right corner defines the color-coding:
* Green: AI
* Red: Human
* Pink: Both
### Detailed Analysis or Content Details
**1. Daily Screen Usage (Top-Left)**
This section displays a network of activities. Node sizes are proportional to usage frequency, indicated by numbers within the nodes.
* Navigate: 3
* Take Photos: 3
* Shop: 3
* Social Media: 8
* Update News: 1
* Play Games: 8
* Keep Relationships: 8
* Read E-book: 8
* Study/Work: 8
* Watch Videos: 8
* Volunteer: 1
**2. Impact of Long Screen Time (Top-Right)**
This section displays a network of negative impacts. Node sizes are proportional to the severity of the impact, indicated by numbers within the nodes.
* Comparison: 1
* FOMO: 4
* Eye Strain: 4
* Insecured: 4
* Stressed: 13
* Isolated: 1
* Overwhelmed: 1
* Self-doubt: 1
* Anxiety or depression due to negative content from social media: 13
* Increased Sense of Belonging: 1
* Insomnia: 13
* Guilty: 4
* Impaired focus: 4
* Reduced ability for face-to-face interaction: 4
* Limited creativity: 4
**3. Strategies to Balance (Bottom-Left)**
This section displays a network of strategies. Node sizes are proportional to the frequency of implementation, indicated by numbers within the nodes.
* Setting Boundaries: 0
* Digital Declutter: 0
* Engage in Offline Hobbies or Activities: 11
* Regular Exercise: 11
* Limit Screen Time with Apps: 11
* Schedule a Fulfilling Life: 5
* Self Reflection: 5
* Technology-Free Zones: 5
* Create a support system with friends: 5
* Practicing Mindfulness: 5
* Set 'Screen-Free' days: 5
* Reminders to Step Away From Screen: 0
* Setting Goals for Online Activities: 0
* Screen Blocking: 0
**4. Effect After Balance (Bottom-Right)**
This section displays a network of positive effects. Node sizes are proportional to the strength of the effect, indicated by numbers within the nodes.
* Anxiety: 2
* Stressful: 1
* Isolation: 1
* Presence: 3
* Fulfilled: 3
* Relaxed: 3
### Key Observations
* **Screen Usage:** Social Media and Study/Work are the most frequent activities (8 each).
* **Negative Impacts:** Stressed, Anxiety/Depression, and Insomnia are the most significant negative impacts (13 each).
* **Balance Strategies:** Engaging in Offline Hobbies/Activities, Regular Exercise, and Limiting Screen Time with Apps are the most frequently implemented strategies (11 each).
* **Positive Effects:** Presence, Fulfilled, and Relaxed are the strongest positive effects (3 each).
* The color coding indicates that most activities and impacts are related to "Human" experience (red).
* Several strategies and effects have a value of 0 or 1, suggesting they are less common or impactful.
### Interpretation
The diagram illustrates a clear relationship between screen usage, negative impacts, balance strategies, and positive effects. High screen usage, particularly in areas like social media and work, is associated with significant negative impacts on mental and emotional well-being (stress, anxiety, insomnia). Implementing balance strategies, especially those involving offline activities, can lead to positive effects such as increased presence, fulfillment, and relaxation.
The large values associated with "Stressed," "Anxiety/Depression," and "Insomnia" suggest these are major concerns related to excessive screen time. The prominence of offline activities as balance strategies highlights the importance of disconnecting from digital devices and engaging in real-world experiences. The diagram suggests a cyclical relationship: increased screen time leads to negative impacts, which motivates the implementation of balance strategies, ultimately resulting in positive effects.
The color coding reinforces the idea that these impacts and strategies are primarily related to the human experience, rather than being driven by AI or a combination of both. The diagram serves as a visual representation of the need for mindful screen usage and proactive strategies to maintain a healthy balance between the digital and physical worlds.