## [Venn Diagram Set]: Screen Usage, Impact, Strategies, and Effects
### Overview
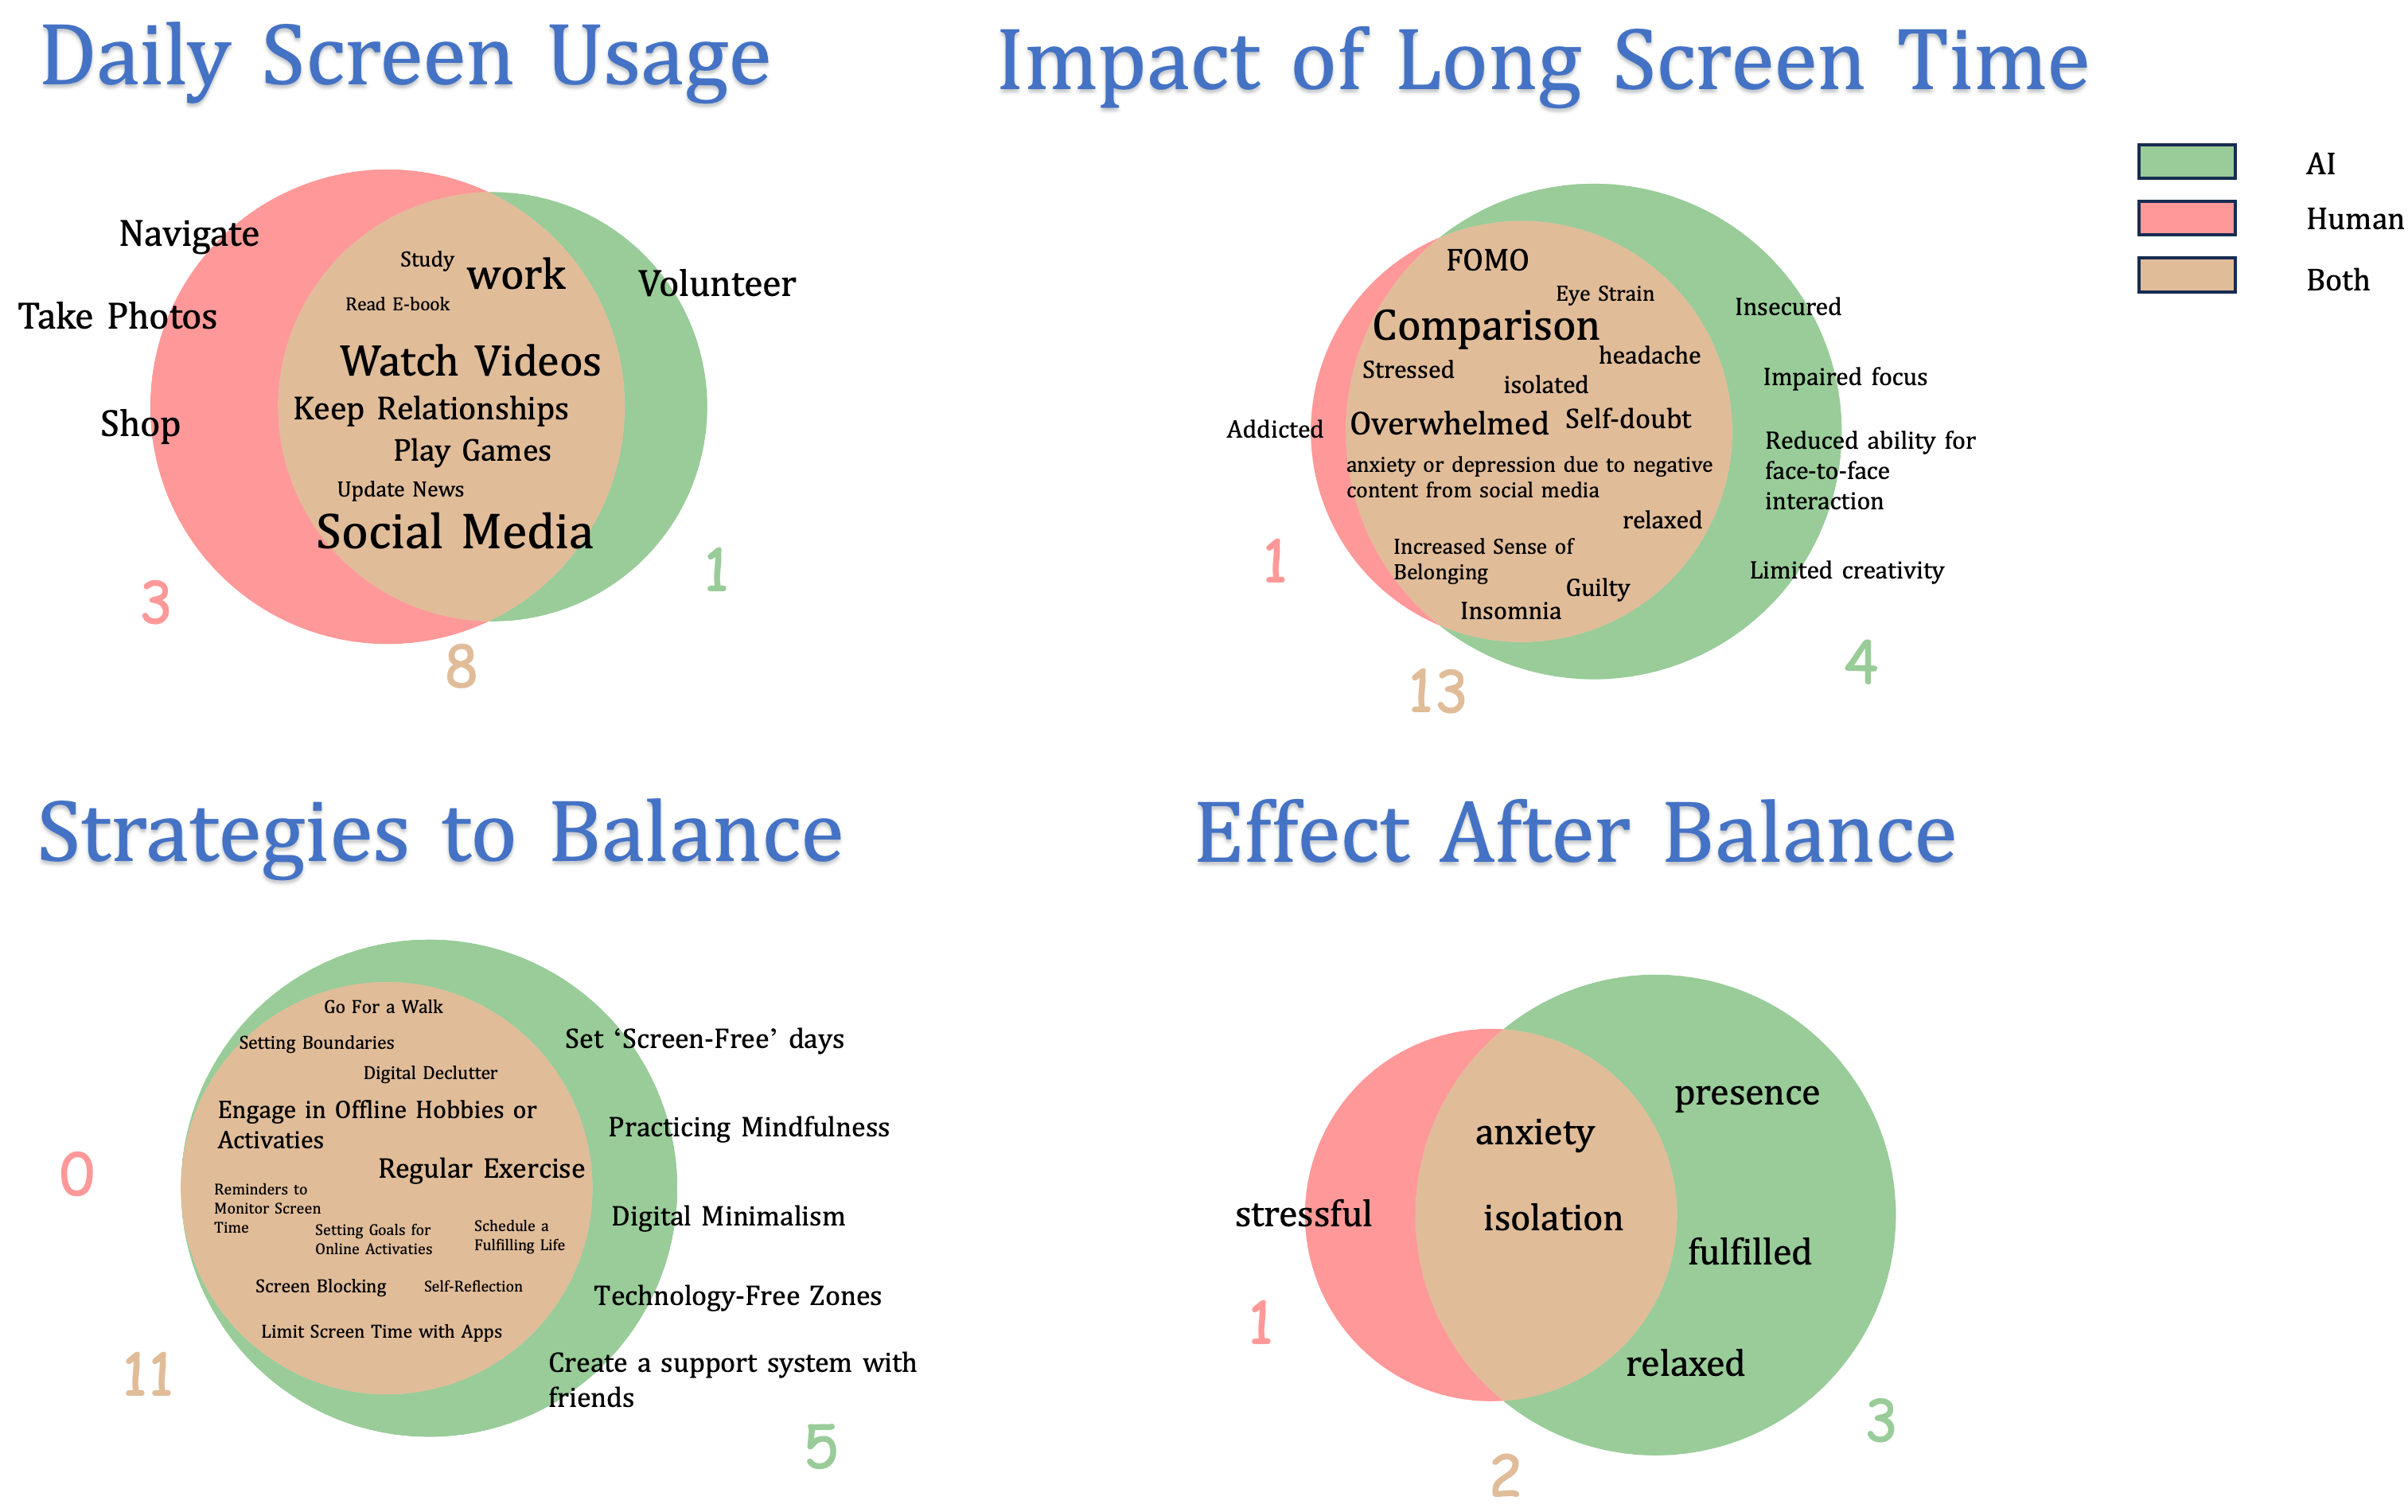
The image contains four Venn diagrams illustrating aspects of screen usage, its impact, balancing strategies, and post-balancing effects. Each diagram uses three color-coded circles: **green (AI)**, **red (Human)**, and **brown (Both)** (legend in the top-right corner).
### 1. Daily Screen Usage (Top-Left)
- **Title**: *Daily Screen Usage*
- **Components**: Venn diagram with three circles (AI: green, Human: red, Both: brown).
- **Human-only (red circle)**: Navigate, Take Photos, Shop (3 items).
- **AI-only (green circle)**: Volunteer (1 item).
- **Both (brown circle)**: Study, Read E-book, Work, Watch Videos, Keep Relationships, Play Games, Update News, Social Media (8 items).
- **Numbers**: Red (3), Green (1), Brown (8).
### 2. Impact of Long Screen Time (Top-Right)
- **Title**: *Impact of Long Screen Time*
- **Components**: Venn diagram with three circles (AI: green, Human: red, Both: brown).
- **Human-only (red circle)**: Addicted, Stressed, Overwhelmed, anxiety or depression due to negative content from social media, Increased Sense of Belonging, Insomnia (6 items; number = 1, note discrepancy).
- **AI-only (green circle)**: Insecured, Impaired focus, Reduced ability for face-to-face interaction, Limited creativity (4 items; number = 4).
- **Both (brown circle)**: FOMO, Eye Strain, Comparison, headache, isolated, Self-doubt, relaxed, Guilty (8 items; number = 13, note discrepancy).
- **Numbers**: Red (1), Green (4), Brown (13).
### 3. Strategies to Balance (Bottom-Left)
- **Title**: *Strategies to Balance*
- **Components**: Venn diagram with three circles (AI: green, Human: red, Both: brown).
- **Human-only (red circle)**: 0 items (red circle is empty; number = 0).
- **AI-only (green circle)**: Set ‘Screen-Free’ days, Practicing Mindfulness, Digital Minimalism, Technology-Free Zones, Create a support system with friends (5 items; number = 5).
- **Both (brown circle)**: Go For a Walk, Setting Boundaries, Digital Declutter, Engage in Offline Hobbies or Activities, Regular Exercise, Reminders to Monitor Screen Time, Setting Goals for Online Activities, Schedule a Fulfilling Life, Screen Blocking, Self-Reflection, Limit Screen Time with Apps (11 items; number = 11).
### 4. Effect After Balance (Bottom-Right)
- **Title**: *Effect After Balance*
- **Components**: Venn diagram with three circles (AI: green, Human: red, Both: brown).
- **Human-only (red circle)**: stressful (1 item; number = 1).
- **AI-only (green circle)**: presence, fulfilled, relaxed (3 items; number = 3).
- **Both (brown circle)**: anxiety, isolation (2 items; number = 2).
### Key Observations
- **Color Coding**: Green = AI, Red = Human, Brown = Both (consistent across all diagrams).
- **Overlap Trends**:
- *Daily Screen Usage*: More shared activities (8) than human-only (3) or AI-only (1).
- *Impact of Long Screen Time*: Most shared impacts (13) and AI-specific impacts (4), with few human-only (1).
- *Strategies to Balance*: No human-only strategies; more shared (11) than AI-only (5).
- *Effect After Balance*: Balanced effects (human: 1, AI: 3, shared: 2).
### Interpretation
- **Screen Usage**: Daily activities involve a mix of human and AI tasks, with significant overlap (e.g., social media, work).
- **Impact**: Long screen time has widespread shared effects (e.g., FOMO, eye strain) and AI-specific harms (e.g., impaired focus), suggesting systemic risks.
- **Balancing Strategies**: Most strategies are shared or AI-driven, indicating a need for collaborative (human + AI) approaches to reduce screen time.
- **Post-Balancing Effects**: Balanced outcomes (e.g., reduced anxiety, increased presence) suggest that intentional balancing mitigates negative impacts.
(Note: Discrepancies between item counts and numbers in some diagrams are noted, but all text is transcribed as visible.)