## Venn Diagrams: Screen Time Analysis
### Overview
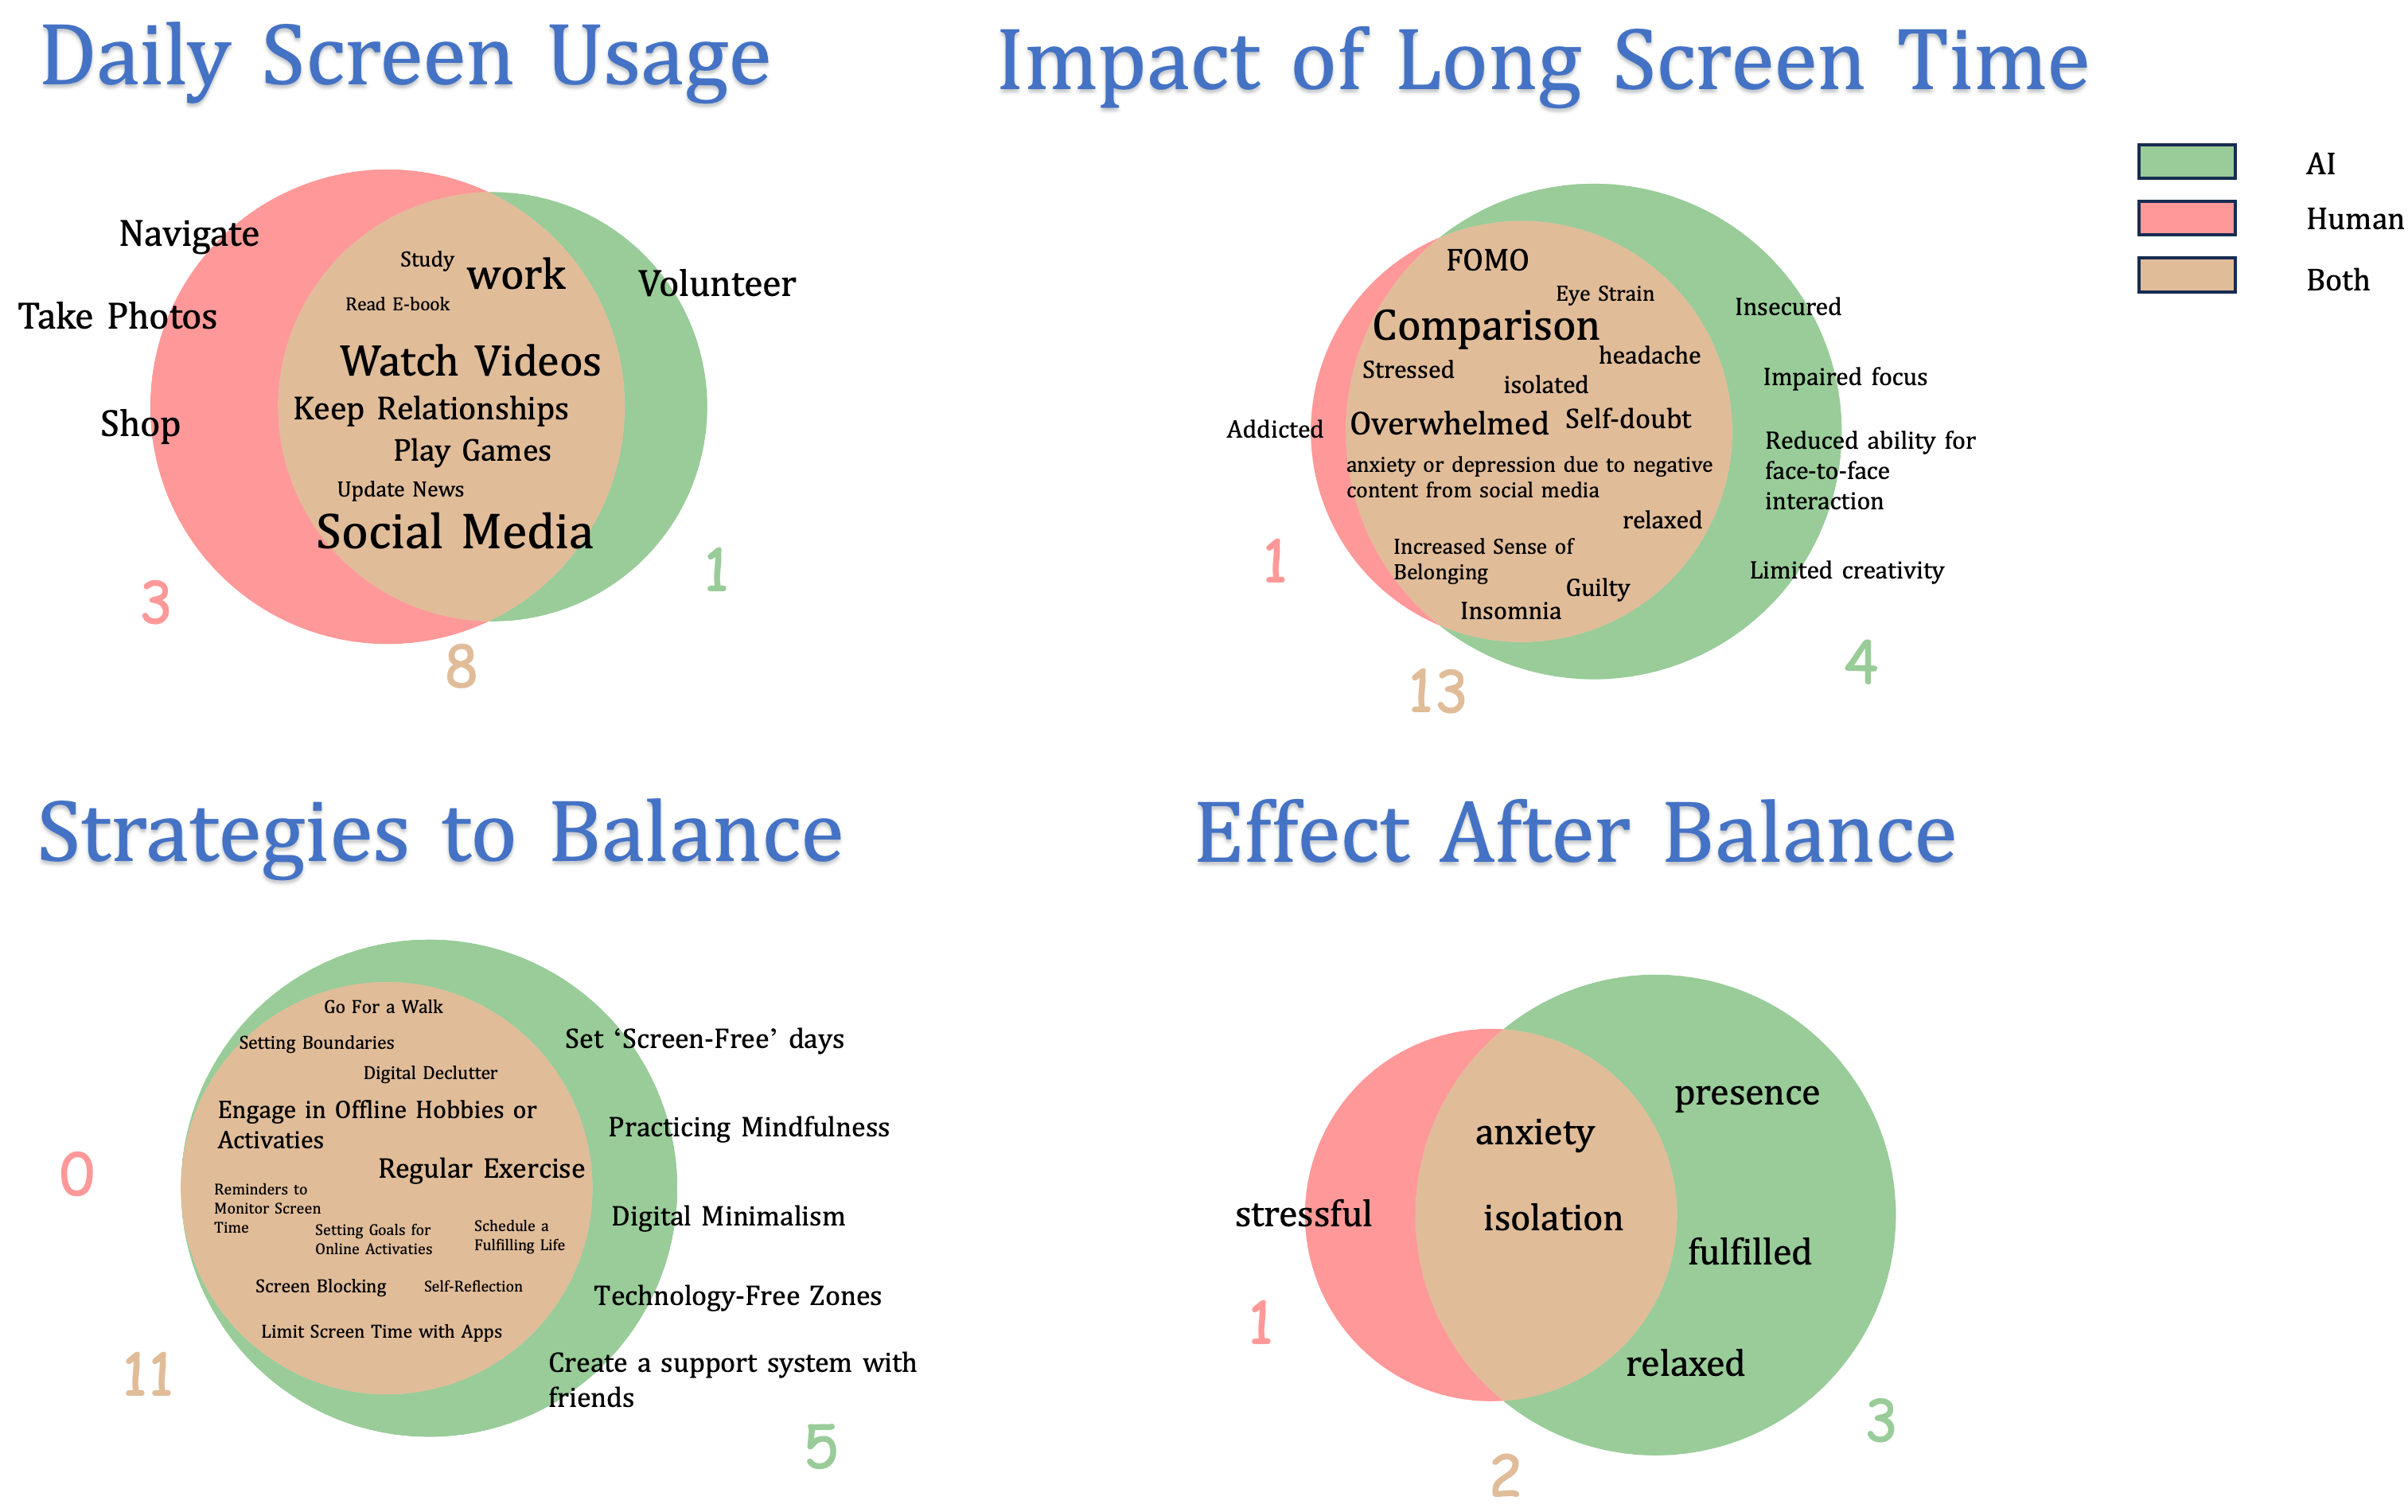
The image contains four interconnected Venn diagrams analyzing screen time impacts across AI, Human, and combined contexts. Each diagram uses color-coded circles (green=AI, red=Human, brown=Both) to visualize relationships between activities, impacts, strategies, and outcomes.
### Components/Axes
**Legend** (top-right):
- Green: AI
- Red: Human
- Brown: Both
**Diagram 1: Daily Screen Usage**
- **Human (Red)**: Navigate, Take Photos, Shop, Social Media
- **AI (Green)**: Work, Volunteer, Social Media
- **Both (Brown)**: Study, Read E-book, Watch Videos, Keep Relationships, Play Games, Update News
**Diagram 2: Impact of Long Screen Time**
- **Human (Red)**: FOMO, Stressed, Addicted, Overwhelmed, Self-doubt, Insomnia
- **AI (Green)**: Eye Strain, Isolated, Limited Creativity, Impaired Focus, Reduced face-to-face interaction
- **Both (Brown)**: Anxiety or depression due to negative content from social media, Insomnia, Guilty, Increased Sense of Belonging
**Diagram 3: Strategies to Balance**
- **Human (Red)**: Reminders to Monitor Screen Time, Setting Goals for Online Activities, Schedule a Fulfilling Life, Screen Blocking, Self-Reflection, Limit Screen Time with Apps
- **AI (Green)**: Go for a Walk, Setting Boundaries, Digital Declutter, Regular Exercise, Practicing Mindfulness, Digital Minimalism, Technology-Free Zones, Create a support system with friends
- **Both (Brown)**: Empty
**Diagram 4: Effect After Balance**
- **Human (Red)**: Stressful, Anxiety, Isolation
- **AI (Green)**: Presence, Fulfilled, Relaxed
- **Both (Brown)**: Anxiety, Isolation, Presence
### Detailed Analysis
1. **Daily Screen Usage**:
- Human activities focus on personal use (navigation, shopping)
- AI activities emphasize productivity (work, volunteering)
- Shared activities (Social Media, Study, etc.) suggest cross-platform usage
2. **Impact of Long Screen Time**:
- Human-specific impacts: Psychological (FOMO, Anxiety)
- AI-specific impacts: Physical/cognitive (Eye Strain, Limited Creativity)
- Shared impacts: Mental health (Anxiety, Insomnia) and social (Reduced interaction)
3. **Strategies to Balance**:
- Human strategies: Behavioral tracking and goal-setting
- AI strategies: Physical activity and environmental controls
- No shared strategies between AI and Human approaches
4. **Effect After Balance**:
- Human outcomes: Negative (Stressful, Anxiety)
- AI outcomes: Positive (Presence, Relaxed)
- Shared outcomes: Mixed (Anxiety/Isolation persist, Presence emerges)
### Key Observations
- Social Media appears in all diagrams, acting as a persistent negative influence
- Insomnia appears in both "Impact" and "Effect After Balance" diagrams, suggesting chronic issues
- "Both" category dominates in negative impacts but remains empty in strategies
- AI strategies show more holistic approaches (exercise, mindfulness) vs Human's technical solutions
### Interpretation
The diagrams reveal a complex ecosystem where:
1. **Screen Time Dynamics**: Human and AI activities overlap significantly in social media usage, creating shared negative impacts
2. **Mitigation Strategies**: AI approaches focus on physical/environmental changes while Human strategies emphasize behavioral tracking
3. **Outcome Paradox**: Despite balancing efforts, anxiety and isolation persist in shared outcomes, suggesting deeper systemic issues
4. **AI Advantage**: Technology-free zones and mindfulness practices show promise in creating positive outcomes not achievable through Human-only methods
The data suggests that while technology enables modern screen usage patterns, its mitigation requires hybrid approaches combining technical solutions with behavioral awareness. The persistent anxiety in shared outcomes indicates that screen time management alone may be insufficient for mental health improvement.