\n
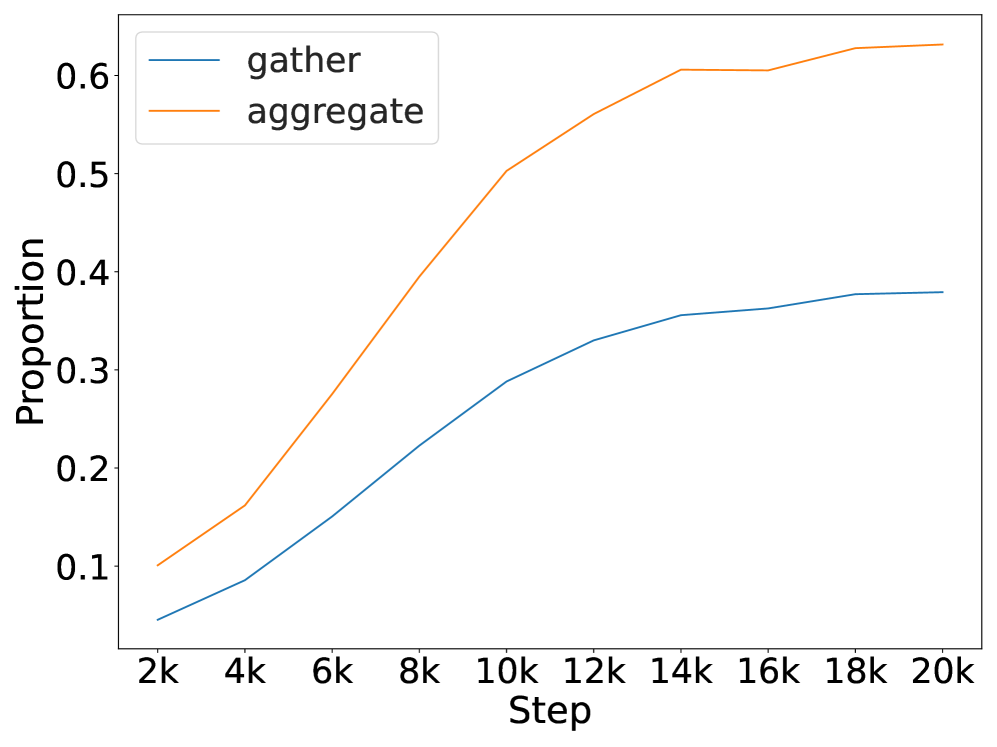
## Line Chart: Proportion vs. Step
### Overview
This image presents a line chart illustrating the proportion of two processes, "gather" and "aggregate", as a function of "Step". The x-axis represents the step count, ranging from 2k to 20k, while the y-axis represents the proportion, ranging from 0 to 0.6. The chart visually compares the progression of these two processes over the specified steps.
### Components/Axes
* **X-axis Label:** "Step"
* Scale: 2k, 4k, 6k, 8k, 10k, 12k, 14k, 16k, 18k, 20k
* **Y-axis Label:** "Proportion"
* Scale: 0, 0.1, 0.2, 0.3, 0.4, 0.5, 0.6
* **Legend:** Located in the top-left corner.
* "gather" - represented by a teal/cyan line.
* "aggregate" - represented by an orange/brown line.
### Detailed Analysis
**"gather" Line (Teal/Cyan):**
The "gather" line starts at approximately 0.07 at 2k and exhibits an increasing trend, leveling off around 0.38 at 18k and 20k.
* 2k: ~0.07
* 4k: ~0.14
* 6k: ~0.21
* 8k: ~0.27
* 10k: ~0.32
* 12k: ~0.35
* 14k: ~0.365
* 16k: ~0.375
* 18k: ~0.38
* 20k: ~0.38
**"aggregate" Line (Orange/Brown):**
The "aggregate" line begins at approximately 0.11 at 2k and demonstrates a steeper increasing trend than the "gather" line. It plateaus around 0.60 at 14k, 16k, 18k and 20k.
* 2k: ~0.11
* 4k: ~0.19
* 6k: ~0.28
* 8k: ~0.37
* 10k: ~0.46
* 12k: ~0.53
* 14k: ~0.59
* 16k: ~0.60
* 18k: ~0.60
* 20k: ~0.60
### Key Observations
* The "aggregate" process reaches a higher proportion than the "gather" process throughout the entire range of steps.
* The "aggregate" process exhibits a more rapid increase in proportion during the initial steps (2k to 10k) compared to the "gather" process.
* Both processes appear to converge in their rate of increase as the step count increases, eventually leveling off.
* The "gather" process shows a relatively slow and steady increase, while the "aggregate" process shows a more significant initial growth followed by stabilization.
### Interpretation
The chart suggests that the "aggregate" process is more efficient or faster at reaching a substantial proportion compared to the "gather" process. The initial rapid increase of "aggregate" could indicate a quick initial phase of consolidation or processing. The leveling off of both lines suggests that both processes reach a point of diminishing returns or saturation as the step count increases. The difference in final proportions indicates that "aggregate" ultimately achieves a greater level of completion or contribution within the defined steps. This data could be related to a data processing pipeline where "gather" represents data collection and "aggregate" represents data consolidation or analysis. The chart demonstrates the relative efficiency of these two stages.