## Line Graph: Proportion of Flips in Qwen2.5-3B Model Across Iterations
### Overview
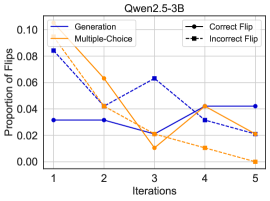
The image is a line graph titled "Qwen2.5-3B" that visualizes the proportion of "flips" (likely model output changes) across five iterations. Two primary data series are plotted: "Generation" (blue solid line with circles) and "Multiple-Choice" (orange dashed line with squares). A legend distinguishes "Correct Flip" (solid black circles) and "Incorrect Flip" (dashed black squares), though these markers are not explicitly plotted on the graph. The y-axis represents the proportion of flips (0.00–0.10), and the x-axis represents iterations (1–5).
---
### Components/Axes
- **X-Axis (Iterations)**: Labeled "Iterations" with discrete markers at 1, 2, 3, 4, and 5.
- **Y-Axis (Proportion of Flips)**: Labeled "Proportion of Flips" with a scale from 0.00 to 0.10 in increments of 0.02.
- **Legend**: Located in the top-right corner, with four entries:
- **Generation**: Solid blue line with filled circles (●).
- **Multiple-Choice**: Dashed orange line with hollow squares (□).
- **Correct Flip**: Solid black circles (●).
- **Incorrect Flip**: Dashed black squares (□).
- **Title**: "Qwen2.5-3B" is centered at the top of the graph.
---
### Detailed Analysis
#### Generation (Blue Solid Line)
- **Trend**: Starts at ~0.085 (iteration 1), drops sharply to ~0.035 (iteration 2), rises to ~0.06 (iteration 3), then fluctuates between ~0.04 and ~0.05 (iterations 4–5).
- **Data Points**:
- Iteration 1: ~0.085
- Iteration 2: ~0.035
- Iteration 3: ~0.06
- Iteration 4: ~0.04
- Iteration 5: ~0.04
#### Multiple-Choice (Orange Dashed Line)
- **Trend**: Begins at ~0.10 (iteration 1), plunges to ~0.02 (iteration 2), dips further to ~0.01 (iteration 3), rises to ~0.04 (iteration 4), and drops to ~0.02 (iteration 5).
- **Data Points**:
- Iteration 1: ~0.10
- Iteration 2: ~0.02
- Iteration 3: ~0.01
- Iteration 4: ~0.04
- Iteration 5: ~0.02
#### Correct Flip (Solid Black Circles) and Incorrect Flip (Dashed Black Squares)
- **Observation**: These markers are not explicitly plotted on the graph. Their presence in the legend suggests they may represent subcategories of the "Generation" and "Multiple-Choice" lines (e.g., correct/incorrect flips within each line). However, no distinct data points for these markers are visible.
---
### Key Observations
1. **Generation Line**: Shows a general downward trend after iteration 1, stabilizing around 0.04 by iteration 5.
2. **Multiple-Choice Line**: Exhibits high volatility, with a sharp decline from iteration 1 to 3, followed by erratic fluctuations.
3. **Legend Ambiguity**: The "Correct Flip" and "Incorrect Flip" markers in the legend do not correspond to visible data points on the graph, suggesting potential mislabeling or incomplete data representation.
4. **Y-Axis Scale**: The proportion of flips is relatively low (<0.10), indicating minimal output instability in later iterations.
---
### Interpretation
- **Model Behavior**: The "Generation" line’s decline suggests improved stability in the model’s output over iterations, while the "Multiple-Choice" line’s volatility implies persistent uncertainty in decision-making tasks.
- **Legend Discrepancy**: The absence of plotted "Correct Flip" and "Incorrect Flip" data points raises questions about their relevance. They may represent theoretical categories not visualized here or errors in the graph’s design.
- **Practical Implications**: The graph highlights the importance of iteration in refining model outputs, with "Generation" tasks showing more predictable behavior than "Multiple-Choice" tasks.
---
### Spatial Grounding
- **Legend Position**: Top-right corner, aligned with the graph’s upper boundary.
- **Line Placement**: "Generation" (blue) is consistently above "Multiple-Choice" (orange) in the early iterations but intersects at iteration 3.
- **Axis Labels**: Centered below (x-axis) and rotated vertically on the left (y-axis).
---
### Content Details
- **Numerical Approximations**: All values are estimated based on grid alignment (e.g., ~0.085 for iteration 1 of the Generation line).
- **Uncertainty**: Due to the lack of gridlines between major ticks, values are approximate (e.g., "~0.04" could range between 0.035–0.045).
---
### Final Notes
The graph provides insights into model performance trends but lacks clarity on the role of "Correct Flip" and "Incorrect Flip" markers. Further data or annotations would be needed to resolve this ambiguity.