## Chart: Proportion of Flips vs. Iterations for Qwen2.5-3B
### Overview
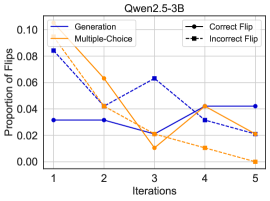
The image is a line chart comparing the proportion of flips (presumably in a model's output) across iterations for different methods (Generation vs. Multiple-Choice) and flip types (Correct vs. Incorrect). The chart displays data for the Qwen2.5-3B model.
### Components/Axes
* **Title:** Qwen2.5-3B
* **X-axis:** Iterations (labeled 1 to 5)
* **Y-axis:** Proportion of Flips (ranging from 0.00 to 0.10)
* **Legend:** Located in the top-left and top-right of the chart.
* **Generation:** Solid dark blue line
* **Multiple-Choice:** Solid orange line
* **Correct Flip:** Solid black line with circle markers
* **Incorrect Flip:** Dashed black line with square markers
### Detailed Analysis
* **Generation (Solid Dark Blue Line):**
* Starts at approximately 0.031 at Iteration 1.
* Remains relatively constant at 0.031 until Iteration 2.
* Increases to approximately 0.063 at Iteration 3.
* Decreases to approximately 0.032 at Iteration 4.
* Increases to approximately 0.042 at Iteration 5.
* **Multiple-Choice (Solid Orange Line):**
* Starts at approximately 0.090 at Iteration 1.
* Decreases to approximately 0.063 at Iteration 2.
* Decreases to approximately 0.010 at Iteration 3.
* Increases to approximately 0.042 at Iteration 4.
* Decreases to approximately 0.021 at Iteration 5.
* **Correct Flip (Dashed Black Line with Square Markers):**
* Starts at approximately 0.084 at Iteration 1.
* Decreases to approximately 0.042 at Iteration 2.
* Decreases to approximately 0.021 at Iteration 3.
* Increases to approximately 0.031 at Iteration 4.
* Decreases to approximately 0.000 at Iteration 5.
* **Incorrect Flip (Solid Black Line with Circle Markers):**
* Starts at approximately 0.084 at Iteration 1.
* Decreases to approximately 0.042 at Iteration 2.
* Decreases to approximately 0.021 at Iteration 3.
* Increases to approximately 0.031 at Iteration 4.
* Decreases to approximately 0.000 at Iteration 5.
### Key Observations
* The "Multiple-Choice" method shows a significant decrease in the proportion of flips from Iteration 1 to Iteration 3, followed by an increase at Iteration 4 and a decrease at Iteration 5.
* The "Generation" method remains relatively stable across iterations, with a slight increase at Iteration 3.
* The "Correct Flip" and "Incorrect Flip" methods follow a similar trend, decreasing from Iteration 1 to Iteration 3, increasing at Iteration 4, and decreasing to zero at Iteration 5.
### Interpretation
The chart compares the proportion of flips for different methods and flip types across iterations for the Qwen2.5-3B model. The "Multiple-Choice" method appears to be more volatile, with significant changes in the proportion of flips across iterations. The "Generation" method is more stable. The "Correct Flip" and "Incorrect Flip" methods show a similar trend, suggesting a correlation between them. The decrease in the proportion of flips for "Correct Flip" and "Incorrect Flip" to zero at Iteration 5 indicates that the model may be converging to a stable state where no flips occur. The data suggests that the "Multiple-Choice" method may require more iterations to converge compared to the "Generation" method.