## Line Chart: Proportion of Flips vs. Iterations (Qwen2.5-3B)
### Overview
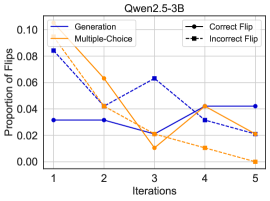
This line chart depicts the proportion of flips across different iterations for various methods: Generation, Multiple-Choice, Correct Flip, and Incorrect Flip. The chart appears to be evaluating the performance of a model (Qwen2.5-3B) over several iterations, likely in a training or evaluation context. The y-axis represents the "Proportion of Flips" and the x-axis represents "Iterations" ranging from 1 to 5.
### Components/Axes
* **Title:** Qwen2.5-3B (top-center)
* **X-axis Label:** Iterations (bottom-center)
* Axis Markers: 1, 2, 3, 4, 5
* **Y-axis Label:** Proportion of Flips (left-center)
* Axis Scale: 0.00 to 0.10, with increments of 0.02
* **Legend:** Located at the top-right corner.
* Generation (Solid Blue Line)
* Multiple-Choice (Solid Orange Line)
* Correct Flip (Black Circle-Line)
* Incorrect Flip (Orange Dashed Line)
### Detailed Analysis
* **Generation (Solid Blue Line):** The line starts at approximately 0.03 at Iteration 1, remains relatively stable around 0.03-0.04 through Iteration 2, increases to a peak of approximately 0.065 at Iteration 3, then decreases to around 0.035 at Iteration 4, and finally stabilizes around 0.04 at Iteration 5.
* **Multiple-Choice (Solid Orange Line):** This line begins at approximately 0.08 at Iteration 1, decreases sharply to around 0.04 at Iteration 2, continues to decrease to a minimum of approximately 0.02 at Iteration 3, increases slightly to around 0.035 at Iteration 4, and then decreases to approximately 0.01 at Iteration 5.
* **Correct Flip (Black Circle-Line):** The line starts at approximately 0.03 at Iteration 1, increases to around 0.055 at Iteration 2, decreases to approximately 0.04 at Iteration 3, increases to around 0.045 at Iteration 4, and remains relatively stable at approximately 0.04 at Iteration 5.
* **Incorrect Flip (Orange Dashed Line):** This line begins at approximately 0.085 at Iteration 1, decreases steadily to around 0.06 at Iteration 2, continues to decrease to approximately 0.04 at Iteration 3, increases slightly to around 0.045 at Iteration 4, and then decreases to approximately 0.015 at Iteration 5.
### Key Observations
* The "Multiple-Choice" and "Incorrect Flip" lines exhibit the most significant downward trends over the five iterations, suggesting a reduction in these types of flips.
* The "Generation" and "Correct Flip" lines remain relatively stable, with some fluctuations, indicating a consistent proportion of these flips.
* At Iteration 1, both "Multiple-Choice" and "Incorrect Flip" have the highest proportion of flips, while "Generation" and "Correct Flip" start with lower proportions.
* By Iteration 5, the "Multiple-Choice" and "Incorrect Flip" proportions have decreased substantially, approaching the levels of "Generation" and "Correct Flip".
### Interpretation
The data suggests that the model (Qwen2.5-3B) is improving over iterations, as indicated by the decreasing proportion of "Multiple-Choice" and "Incorrect Flip" events. This could mean the model is becoming more accurate or more confident in its responses, leading to fewer instances where multiple choices are considered or incorrect flips occur. The stability of the "Generation" and "Correct Flip" lines suggests that these aspects of the model's performance are relatively consistent throughout the iterations. The initial high proportion of "Multiple-Choice" and "Incorrect Flip" events might indicate a period of exploration or learning, where the model is still refining its understanding. The overall trend points towards a positive learning trajectory for the model. The fact that the "Incorrect Flip" line is consistently higher than the "Correct Flip" line suggests that there is still room for improvement in the model's ability to avoid incorrect responses.