## Line Chart: Qwen2.5-3B Flip Proportions Over Iterations
### Overview
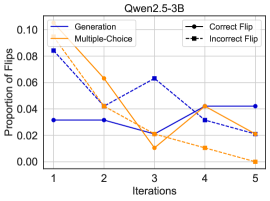
This is a line chart titled "Qwen2.5-3B" that plots the "Proportion of Flips" against "Iterations" for four distinct data series. The chart tracks how the frequency of different types of "flips" (likely changes in model output or behavior) evolves over five sequential iterations. The visual style uses solid and dashed lines in blue and orange, with distinct markers for the dashed series.
### Components/Axes
* **Title:** "Qwen2.5-3B" (centered at the top).
* **Y-Axis:** Labeled "Proportion of Flips". The scale runs from 0.00 to 0.10, with major tick marks at 0.00, 0.02, 0.04, 0.06, 0.08, and 0.10.
* **X-Axis:** Labeled "Iterations". The scale shows discrete integer values from 1 to 5.
* **Legend:** Positioned in the top-right corner of the plot area. It defines four series:
1. **Generation:** Solid blue line.
2. **Multiple-Choice:** Solid orange line.
3. **Correct Flip:** Dashed blue line with circular markers.
4. **Incorrect Flip:** Dashed orange line with square markers.
### Detailed Analysis
The following data points are approximate values extracted from the chart's visual representation.
**1. Generation (Solid Blue Line)**
* **Trend:** Starts low, remains flat, dips slightly, then rises and plateaus.
* **Data Points:**
* Iteration 1: ~0.03
* Iteration 2: ~0.03
* Iteration 3: ~0.02
* Iteration 4: ~0.04
* Iteration 5: ~0.04
**2. Multiple-Choice (Solid Orange Line)**
* **Trend:** Shows a sharp initial decline, a low point at iteration 3, a partial recovery, and a final decline.
* **Data Points:**
* Iteration 1: ~0.09
* Iteration 2: ~0.06
* Iteration 3: ~0.01
* Iteration 4: ~0.04
* Iteration 5: ~0.02
**3. Correct Flip (Dashed Blue Line, Circle Markers)**
* **Trend:** Begins high, drops, peaks at iteration 3, then declines steadily.
* **Data Points:**
* Iteration 1: ~0.08
* Iteration 2: ~0.04
* Iteration 3: ~0.06
* Iteration 4: ~0.03
* Iteration 5: ~0.02
**4. Incorrect Flip (Dashed Orange Line, Square Markers)**
* **Trend:** Shows a consistent downward trend, approaching zero by the final iteration.
* **Data Points:**
* Iteration 1: ~0.09
* Iteration 2: ~0.05
* Iteration 3: ~0.02
* Iteration 4: ~0.04
* Iteration 5: ~0.00
### Key Observations
* **Highest Initial Values:** At Iteration 1, both "Multiple-Choice" and "Incorrect Flip" have the highest proportion of flips (~0.09).
* **Convergence at Iteration 3:** Three of the four lines ("Generation", "Multiple-Choice", "Incorrect Flip") converge at or near their lowest points at Iteration 3.
* **Divergence at Iteration 4:** There is a notable rebound at Iteration 4 for "Multiple-Choice", "Correct Flip", and "Incorrect Flip", while "Generation" also rises.
* **Final State (Iteration 5):** "Incorrect Flip" drops to approximately 0.00. "Correct Flip" and "Multiple-Choice" end at similar low levels (~0.02). "Generation" ends as the highest series at ~0.04.
* **Line Style Correlation:** The dashed lines ("Correct/Incorrect Flip") generally show more volatility (sharper peaks and troughs) compared to the solid lines ("Generation/Multiple-Choice").
### Interpretation
The chart likely illustrates the behavior of a language model (Qwen2.5-3B) during an iterative process, such as fine-tuning, reinforcement learning, or a multi-step reasoning task. "Flips" probably refer to changes in the model's output between iterations.
* **Performance Improvement:** The steady decline of the "Incorrect Flip" line to near zero suggests the model is becoming more stable and consistent in its outputs, reducing erroneous changes.
* **Task-Specific Behavior:** The distinct paths of "Generation" (open-ended text) and "Multiple-Choice" (constrained selection) indicate the model's flip dynamics differ significantly based on task type. Multiple-choice flips are initially very high but drop dramatically.
* **The Iteration 3 Inflection Point:** The synchronized low point at Iteration 3 for most series could indicate a key phase in the process—perhaps a point of maximum stability or a change in the training/evaluation protocol—before a subsequent adjustment phase (Iteration 4).
* **Correct vs. Incorrect Flips:** The fact that "Correct Flip" remains above "Incorrect Flip" after the first iteration, and that "Incorrect Flip" vanishes, implies that when the model does change its output in later iterations, it is more likely to be a change towards a correct answer. This is a positive indicator of learning or refinement.
**Language:** All text in the image is in English.