# Technical Document Extraction: Model Performance Analysis
## 1. Image Overview
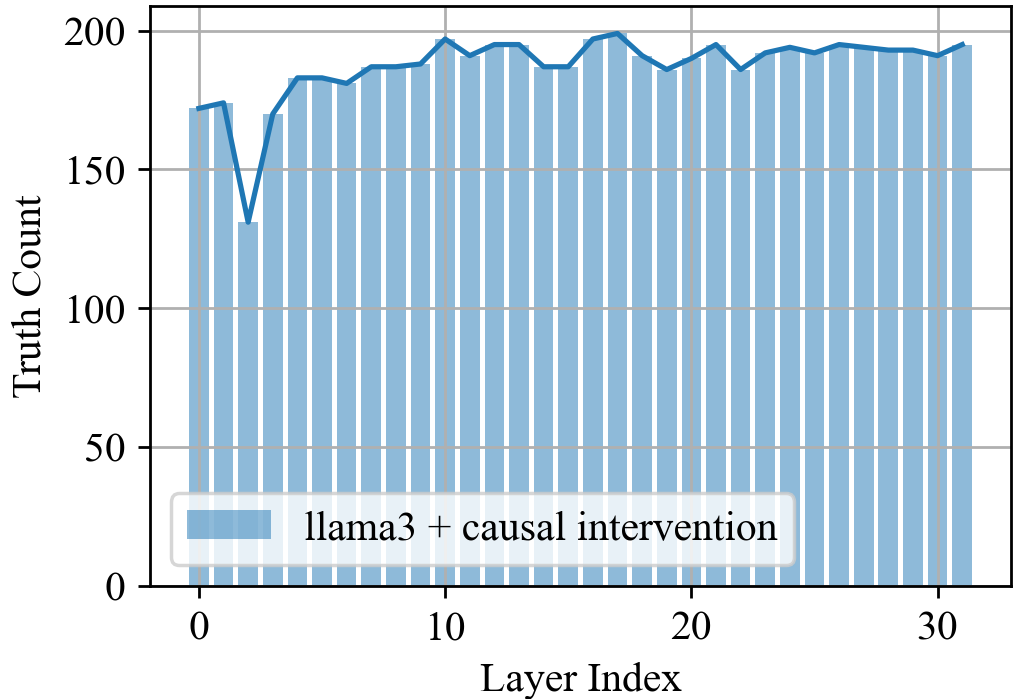
This image is a combined bar and line chart illustrating the performance of a specific Large Language Model configuration across its internal architecture. The chart tracks a metric called "Truth Count" against the "Layer Index" of the model.
## 2. Component Isolation
### A. Header/Title
* **Content:** None present.
### B. Main Chart Area
* **Chart Type:** Combined Bar Chart and Line Graph.
* **X-Axis Label:** Layer Index
* **X-Axis Scale:** 0 to 32 (representing the layers of the model). Major tick marks are placed at intervals of 10 (0, 10, 20, 30).
* **Y-Axis Label:** Truth Count
* **Y-Axis Scale:** 0 to 200. Major tick marks are placed at intervals of 50 (0, 50, 100, 150, 200).
* **Grid:** A light gray orthogonal grid is present, aligned with the major axis ticks.
### C. Legend
* **Spatial Placement:** Bottom-left corner of the plot area (approximate coordinates [0.1, 0.1] in normalized plot space).
* **Label:** `llama3 + causal intervention`
* **Visual Key:** A light blue rectangle (matching the bars) and a dark blue line (matching the line graph).
## 3. Data Extraction and Trend Verification
### Trend Analysis
The data series represents the performance of **llama3 + causal intervention**.
* **Initial Phase (Layers 0-2):** Starts relatively high (~175), maintains for one layer, then shows a significant sharp dip at Layer 2.
* **Recovery Phase (Layers 3-5):** A sharp upward slope as the model recovers from the dip.
* **Stabilization Phase (Layers 6-31):** The "Truth Count" stabilizes into a high-plateau region, fluctuating slightly between 185 and 200. There is a slight overall upward trend toward the middle layers (10-17) before maintaining a consistent high performance through the final layer.
### Estimated Data Points
*Note: Values are estimated based on the Y-axis scale.*
| Layer Index | Truth Count (Approx.) | Observation |
| :--- | :--- | :--- |
| 0 | 172 | Starting point |
| 1 | 175 | Slight rise |
| 2 | 132 | **Significant local minimum** |
| 3 | 170 | Sharp recovery |
| 4 | 183 | Continued recovery |
| 5 | 183 | Plateau |
| 10 | 197 | Local peak |
| 15 | 188 | Minor dip in plateau |
| 17 | 199 | **Global maximum** |
| 20 | 187 | Minor fluctuation |
| 31 | 195 | Final layer performance |
## 4. Summary of Findings
The chart demonstrates that the "llama3 + causal intervention" method achieves a high "Truth Count" (near the 200 mark) across the majority of its layers. The most notable feature is a performance drop at Layer 2, followed by a rapid recovery. From Layer 4 onwards, the model maintains a consistently high truth count, suggesting that the causal intervention is effective across the depth of the network, particularly in the middle and later layers.