\n
## Bar Chart: Truth Count vs. Layer Index for llama3 + causal intervention
### Overview
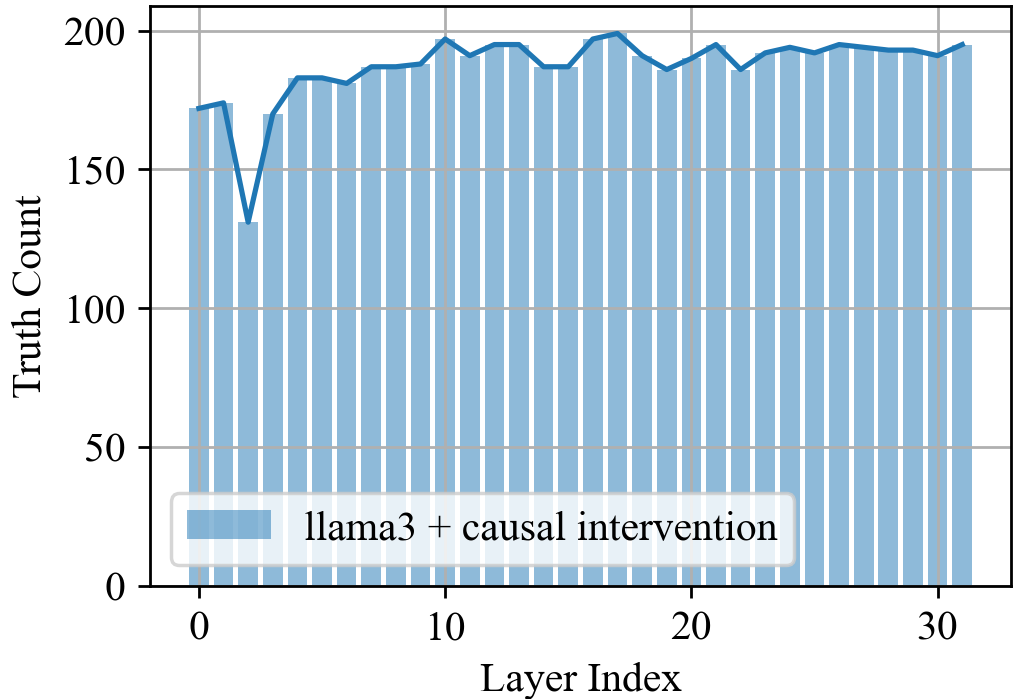
This image presents a bar chart illustrating the "Truth Count" across different "Layer Index" values for a model identified as "llama3 + causal intervention". The chart displays the distribution of truth counts as the layer index increases.
### Components/Axes
* **X-axis:** "Layer Index", ranging from approximately 0 to 32. The axis is divided into discrete intervals representing individual layers.
* **Y-axis:** "Truth Count", ranging from 0 to 200. This represents the number of "truths" associated with each layer.
* **Legend:** Located in the bottom-left corner, the legend identifies the data series as "llama3 + causal intervention" and uses a light blue color to represent it.
* **Data Series:** A single data series represented by light blue bars.
### Detailed Analysis
The chart shows a fluctuating "Truth Count" as the "Layer Index" increases.
* **Initial Drop:** The chart begins at Layer Index 0 with a "Truth Count" of approximately 175, then drops sharply to around 130 at Layer Index 1.
* **Increasing Trend (Layers 1-10):** From Layer Index 1 to approximately Layer Index 10, the "Truth Count" generally increases, reaching a peak of around 190.
* **Plateau and Fluctuation (Layers 10-32):** Between Layer Index 10 and Layer Index 32, the "Truth Count" plateaus, fluctuating between approximately 175 and 195. There are several minor peaks and valleys within this range.
Here's a more detailed breakdown of approximate values:
* Layer Index 0: ~175
* Layer Index 1: ~130
* Layer Index 2: ~160
* Layer Index 4: ~175
* Layer Index 6: ~185
* Layer Index 8: ~190
* Layer Index 10: ~190
* Layer Index 12: ~180
* Layer Index 14: ~185
* Layer Index 16: ~190
* Layer Index 18: ~180
* Layer Index 20: ~185
* Layer Index 22: ~175
* Layer Index 24: ~180
* Layer Index 26: ~190
* Layer Index 28: ~190
* Layer Index 30: ~185
* Layer Index 32: ~180
### Key Observations
* The initial drop in "Truth Count" at Layer Index 1 is a notable feature.
* The "Truth Count" stabilizes after Layer Index 10, indicating a consistent level of truthfulness across the remaining layers.
* The fluctuations between Layer Index 10 and 32 are relatively small, suggesting that the model's performance remains stable across these layers.
### Interpretation
The chart suggests that the "llama3 + causal intervention" model experiences an initial adjustment period in its early layers (Layer Index 0-1), followed by a period of increasing truthfulness and then a stable performance across subsequent layers. The initial drop could indicate a refinement or filtering process occurring in the first layer, potentially removing less reliable information. The stabilization of the "Truth Count" after Layer Index 10 suggests that the model has converged to a consistent level of accuracy and reliability. The fluctuations within the stable range could be attributed to the inherent complexity of the data or the model's internal workings. The data demonstrates the model's ability to maintain a relatively high level of truthfulness as it processes information through its layers.