## Bar Chart with Line Graph Overlay: Truth Count Across Layer Indices
### Overview
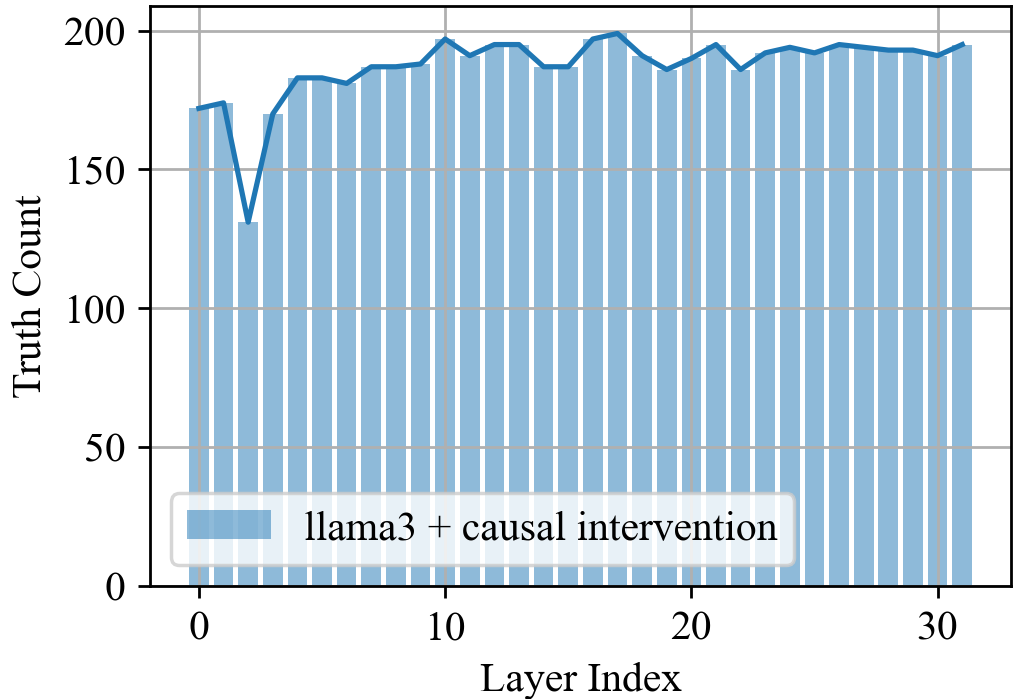
The image displays a bar chart with a superimposed line graph, illustrating the relationship between "Layer Index" (x-axis) and "Truth Count" (y-axis). The chart includes a legend labeled "llama3 + causal intervention" in blue, indicating the data series. The bars are uniformly blue, while the line graph shows fluctuations, including a notable dip at layer index 2.
### Components/Axes
- **X-axis (Layer Index)**: Labeled "Layer Index," with ticks at 0, 10, 20, and 30.
- **Y-axis (Truth Count)**: Labeled "Truth Count," with ticks at 0, 50, 100, 150, and 200.
- **Legend**: Positioned at the bottom-left corner, labeled "llama3 + causal intervention" in blue.
- **Bars**: Uniform blue bars representing data points for each layer index.
- **Line Graph**: A blue line overlaid on the bars, showing trends and fluctuations.
### Detailed Analysis
- **Bars**: The bars are consistently spaced and uniformly blue, suggesting a baseline or reference metric. Their height appears to align with the line graph’s values, though no explicit label is provided for the bars.
- **Line Graph**:
- **Trend**: The line generally trends upward, with minor fluctuations.
- **Notable Dip**: At layer index 2, the line drops sharply to approximately 130–140 (y-axis), significantly lower than the surrounding values (170–180).
- **Peaks**: The line reaches near-maximum values (190–200) at layer indices 10, 15, and 25.
- **Stability**: After layer index 2, the line stabilizes around 180–190, with minor oscillations.
### Key Observations
1. **Anomaly at Layer 2**: The sharp dip in the line graph at layer index 2 is the most prominent outlier, deviating by ~30–40 units from the baseline.
2. **Consistency of Bars**: The bars show no variation, implying a static or controlled metric.
3. **Line Graph Variability**: The line graph exhibits both upward trends and localized fluctuations, suggesting dynamic changes in "Truth Count" across layers.
### Interpretation
The data suggests that the "llama3 + causal intervention" metric generally increases across layer indices, with a significant anomaly at layer 2. The uniform bars may represent a baseline or control group, while the line graph highlights dynamic changes, possibly reflecting the impact of the causal intervention. The dip at layer 2 could indicate a temporary disruption, error, or specific event in that layer. The overall upward trend implies a positive correlation between layer index and "Truth Count," though the anomaly warrants further investigation.
**Note**: The image does not explicitly label the bars, so their purpose remains ambiguous. The line graph’s legend is the only explicit textual reference, and the bars may represent an unlabelled dataset or a smoothed version of the line data.