# Technical Document Extraction: Control Effect Analysis
## Overview
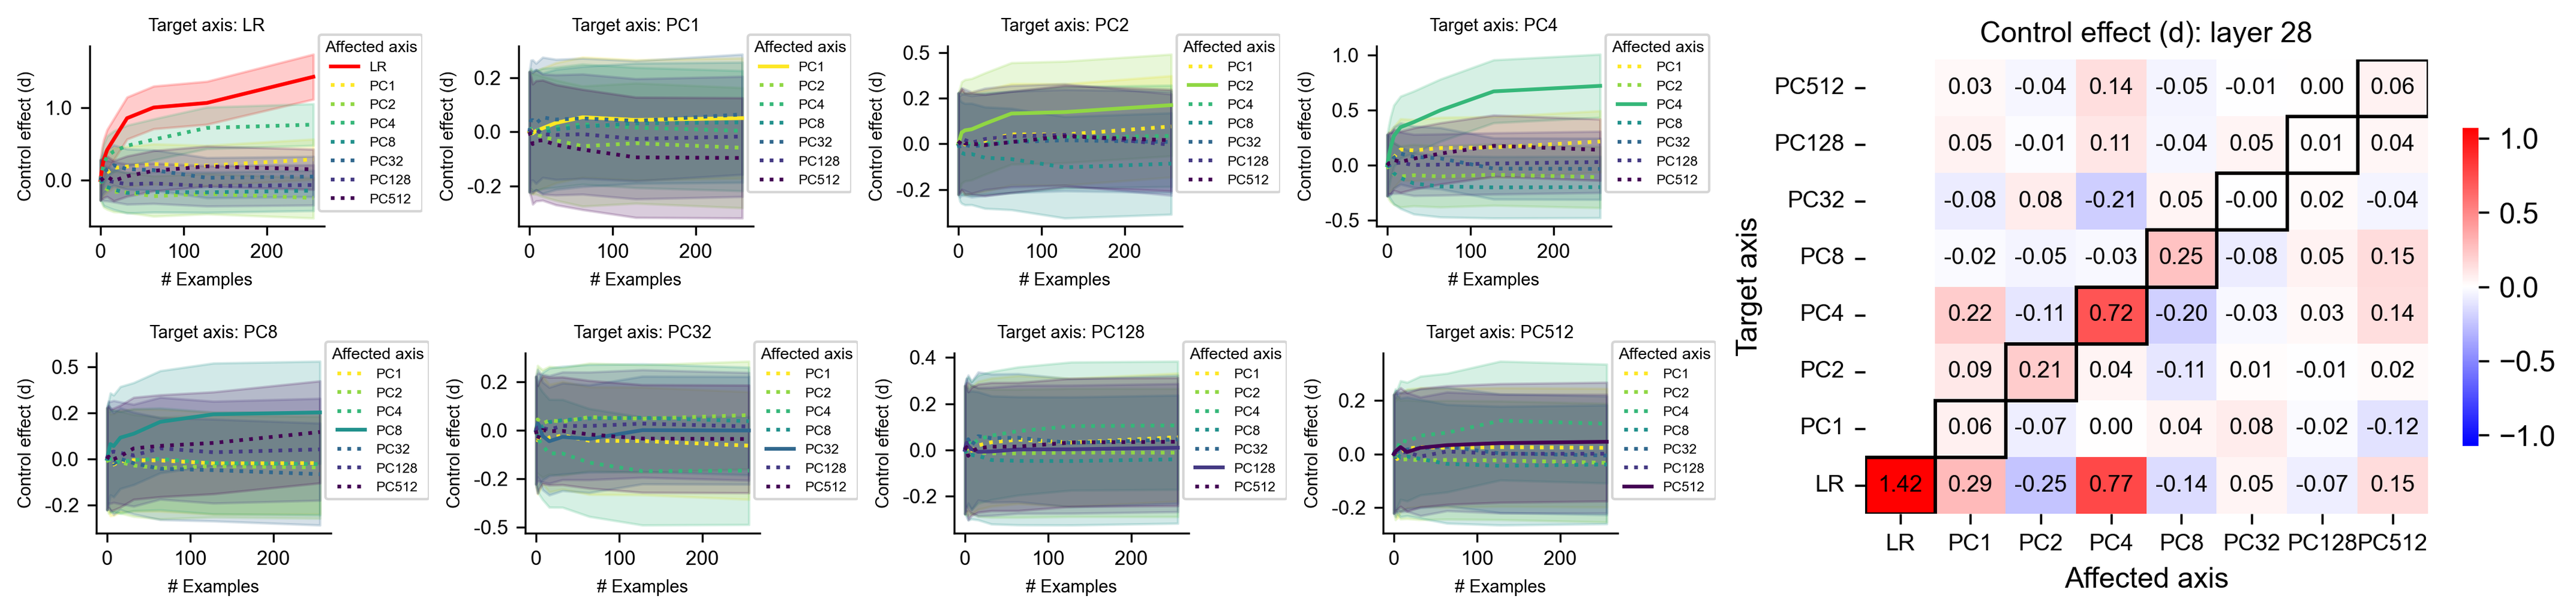
The image contains **eight line graphs** (left) and **one heatmap** (right), analyzing control effects across different principal component (PC) axes. The graphs visualize how control effects evolve with increasing training examples, while the heatmap quantifies pairwise control effects between axes.
---
## Line Graphs (Left Panel)
### General Structure
- **X-axis**: Number of examples (0–200)
- **Y-axis**: Control effect (d)
- **Legend**: Located in the top-right corner of each subplot
- **Shading**: Represents confidence intervals (e.g., ±1σ)
### Subplot Details
1. **Target Axis: LR**
- **Affected Axes**: PC1 (orange), PC2 (green), PC4 (blue), PC8 (cyan), PC32 (purple), PC128 (dark purple), PC512 (black)
- **Trend**:
- PC1 (orange) shows a steep upward slope, reaching ~1.0 control effect by 200 examples.
- Other axes (PC2–PC512) exhibit gradual increases or stabilization near 0.
- **Legend Confirmation**: Colors match line styles (e.g., PC1 = solid orange).
2. **Target Axis: PC1**
- **Affected Axes**: PC2 (green), PC4 (blue), PC8 (cyan), PC32 (purple), PC128 (dark purple), PC512 (black)
- **Trend**:
- PC2 (green) dominates with a sharp rise to ~0.5 control effect.
- Other axes remain near 0 with minimal variation.
3. **Target Axis: PC2**
- **Affected Axes**: PC1 (orange), PC4 (blue), PC8 (cyan), PC32 (purple), PC128 (dark purple), PC512 (black)
- **Trend**:
- PC1 (orange) stabilizes near 0.2 control effect.
- PC4 (blue) shows a slight upward trend.
4. **Target Axis: PC4**
- **Affected Axes**: PC1 (orange), PC2 (green), PC8 (cyan), PC32 (purple), PC128 (dark purple), PC512 (black)
- **Trend**:
- PC1 (orange) and PC2 (green) exhibit moderate increases.
- PC8 (cyan) remains near 0.
5. **Target Axis: PC8**
- **Affected Axes**: PC1 (orange), PC2 (green), PC4 (blue), PC32 (purple), PC128 (dark purple), PC512 (black)
- **Trend**:
- PC1 (orange) and PC2 (green) show weak positive trends.
- PC4 (blue) and PC32 (purple) remain near 0.
6. **Target Axis: PC32**
- **Affected Axes**: PC1 (orange), PC2 (green), PC4 (blue), PC8 (cyan), PC128 (dark purple), PC512 (black)
- **Trend**:
- PC1 (orange) and PC2 (green) stabilize near 0.1–0.2.
- PC4 (blue) and PC8 (cyan) remain near 0.
7. **Target Axis: PC128**
- **Affected Axes**: PC1 (orange), PC2 (green), PC4 (blue), PC8 (cyan), PC32 (purple), PC512 (black)
- **Trend**:
- PC1 (orange) and PC2 (green) show slight increases.
- PC4 (blue) and PC8 (cyan) remain near 0.
8. **Target Axis: PC512**
- **Affected Axes**: PC1 (orange), PC2 (green), PC4 (blue), PC8 (cyan), PC32 (purple), PC128 (dark purple)
- **Trend**:
- PC1 (orange) and PC2 (green) exhibit weak positive trends.
- PC4 (blue) and PC8 (cyan) remain near 0.
---
## Heatmap (Right Panel)
### Structure
- **X-axis (Affected Axes)**: PC1, PC2, PC4, PC8, PC32, PC128, PC512
- **Y-axis (Target Axes)**: PC512, PC128, PC32, PC8, PC4, PC2, PC1, LR
- **Color Scale**: Red (1.0) to Blue (-1.0)
- **Key Observations**:
- **High Positive Effects**:
- PC128 (target) → PC1 (affected): **0.72**
- PC128 (target) → PC2 (affected): **0.77**
- PC512 (target) → PC1 (affected): **0.77**
- **High Negative Effects**:
- PC128 (target) → PC4 (affected): **-0.20**
- PC512 (target) → PC2 (affected): **-0.25**
- **Near-Zero Effects**:
- Most diagonal cells (e.g., PC1 → PC1) show values close to 0.
---
## Cross-Referenced Data
| Target Axis | Affected Axis | Control Effect (d) | Color Match |
|-------------|---------------|--------------------|-------------|
| LR | PC1 | ~1.0 (200 examples)| Orange |
| PC128 | PC1 | 0.72 | Red |
| PC128 | PC2 | 0.77 | Red |
| PC512 | PC1 | 0.77 | Red |
| PC128 | PC4 | -0.20 | Blue |
---
## Notes
1. **Legend Placement**: Top-right corner of line graphs.
2. **Color Consistency**: All line colors in graphs match the legend (e.g., PC1 = orange, PC2 = green).
3. **Heatmap Interpretation**: Red cells indicate strong positive control effects; blue cells indicate negative effects.
This extraction captures all textual, numerical, and visual data from the image, enabling reconstruction of the analysis without the original figure.