## Diagram: Malware Mitigation Strategies
### Overview
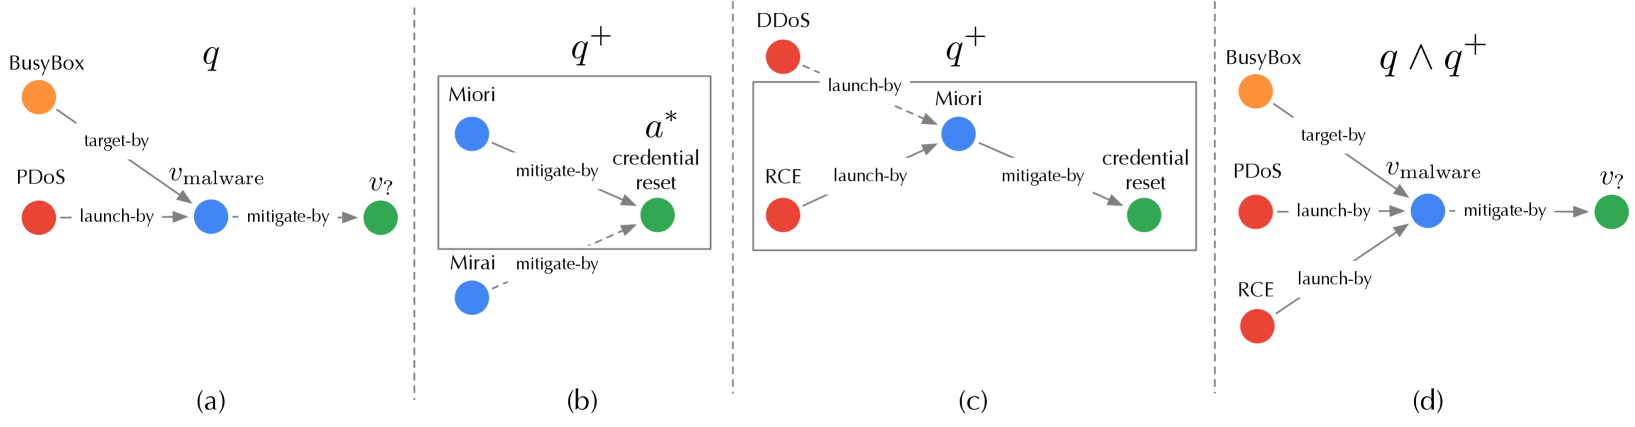
The image presents a series of diagrams illustrating different malware mitigation strategies. Each diagram depicts a sequence of events, starting with an initial state and progressing through various actions and responses. The diagrams are labeled (a), (b), (c), and (d), and they represent different scenarios or stages in the mitigation process. The diagrams use colored nodes to represent different entities or states, and labeled arrows to indicate actions or relationships between them.
### Components/Axes
* **Nodes:**
* Orange: BusyBox
* Red: PDOS, DDOS, RCE
* Blue: Malware (unspecified), Miori, Mirai
* Green: Mitigation/Reset State
* **Edges:**
* Solid Gray Arrows: Represent actions or relationships (e.g., "target-by", "launch-by", "mitigate-by").
* Dashed Gray Arrows: Represent actions or relationships (e.g., "mitigate-by").
* **Labels:**
* (a), (b), (c), (d): Diagram identifiers.
* q, q+, q ∧ q+: State or condition labels for each diagram.
* vmalware: Label on an edge, indicating malware involvement.
* v?: Label on an edge, indicating an unknown or questioned action.
* a*: Label indicating credential reset.
### Detailed Analysis
**Diagram (a): q**
* **Nodes:** BusyBox (orange), PDOS (red), Malware (blue), Mitigation (green).
* **Edges:**
* BusyBox --target-by--> Malware
* PDOS --launch-by--> Malware
* Malware --mitigate-by--> Mitigation
* **Trend:** Shows a simple attack chain where BusyBox is targeted, PDOS launches an attack, and then mitigation occurs.
**Diagram (b): q+**
* **Nodes:** Miori (blue), Mirai (blue), Credential Reset (green).
* **Edges:**
* Miori --mitigate-by--> Credential Reset
* Mirai --mitigate-by--> Credential Reset
* **Trend:** Shows Miori and Mirai being mitigated by a credential reset. The entire diagram is enclosed in a gray box.
**Diagram (c): q+**
* **Nodes:** DDOS (red), RCE (red), Miori (blue), Credential Reset (green).
* **Edges:**
* DDOS --launch-by--> Miori
* RCE --launch-by--> Miori
* Miori --mitigate-by--> Credential Reset
* **Trend:** Shows DDOS and RCE launching attacks on Miori, which is then mitigated by a credential reset. The entire diagram is enclosed in a gray box.
**Diagram (d): q ∧ q+**
* **Nodes:** BusyBox (orange), PDOS (red), RCE (red), Malware (blue), Mitigation (green).
* **Edges:**
* BusyBox --target-by--> Malware
* PDOS --launch-by--> Malware
* RCE --launch-by--> Malware
* Malware --mitigate-by--> Mitigation
* **Trend:** Shows a combined attack from BusyBox, PDOS, and RCE targeting Malware, followed by mitigation.
### Key Observations
* The diagrams illustrate different attack scenarios and mitigation strategies.
* Diagrams (b) and (c) are enclosed in gray boxes, possibly indicating a specific context or scope.
* The color-coding of nodes helps to differentiate between different entities involved in the attack and mitigation process.
* The labels on the edges provide information about the type of action or relationship between the nodes.
### Interpretation
The diagrams provide a visual representation of various malware attack scenarios and the corresponding mitigation strategies. They demonstrate how different entities (BusyBox, PDOS, DDOS, RCE, Miori, Mirai) can be involved in attacks, and how mitigation measures like credential reset can be used to counter these attacks. The use of different diagrams (q, q+, q ∧ q+) suggests a progression or combination of different states or conditions in the attack and mitigation process. The "v?" label indicates uncertainty or a question mark regarding a specific action, suggesting an area for further investigation or analysis. The diagrams highlight the complexity of malware attacks and the importance of having effective mitigation strategies in place.