## Diagram: Malware Attack and Mitigation Logic Chains
### Overview
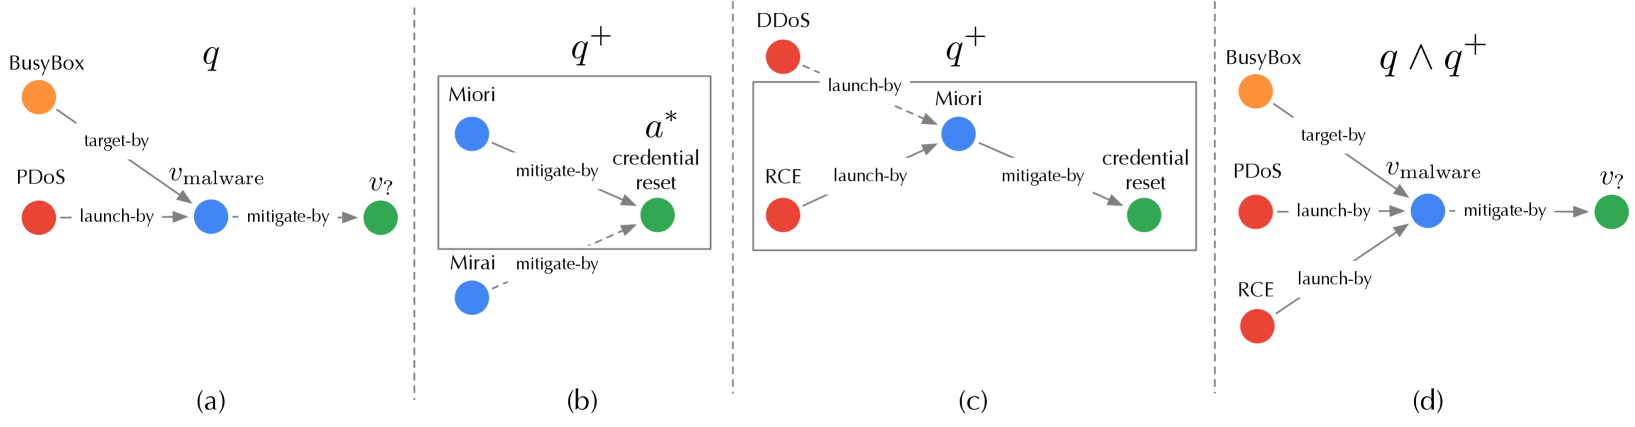
This image presents four distinct logical diagrams, labeled (a) through (d), which illustrate the relationships between various malware types, attack vectors, and mitigation strategies. The diagrams use a node-link structure to represent a cybersecurity threat model, where nodes represent entities (malware, attack types, mitigation outcomes) and edges represent the logical relationships between them (e.g., "target-by," "launch-by," "mitigate-by").
### Components/Axes
The diagrams are organized into four vertical panels separated by dashed lines. The color coding is consistent across all panels:
* **Orange Nodes:** Represent initial targets or sources (e.g., BusyBox).
* **Red Nodes:** Represent attack vectors or methods (e.g., PDoS, DDoS, RCE).
* **Blue Nodes:** Represent malware strains or intermediate states (e.g., $v_{malware}$, Miori, Mirai).
* **Green Nodes:** Represent mitigation outcomes or actions (e.g., $v_?$, credential reset).
### Detailed Analysis
#### Panel (a): $q$
* **Structure:** A linear flow from left to right.
* **Nodes:**
* **BusyBox (Orange):** Positioned top-left.
* **PDoS (Red):** Positioned bottom-left.
* **$v_{malware}$ (Blue):** Positioned center-right.
* **$v_?$ (Green):** Positioned far-right.
* **Relationships:**
* BusyBox connects to $v_{malware}$ via a "target-by" edge.
* PDoS connects to $v_{malware}$ via a "launch-by" edge.
* $v_{malware}$ connects to $v_?$ via a "mitigate-by" edge.
#### Panel (b): $q^+$
* **Structure:** Enclosed within a grey rectangular box.
* **Nodes:**
* **Miori (Blue):** Top-left inside the box.
* **Mirai (Blue):** Bottom-left inside the box.
* **$a^*$ (Green):** Labeled "credential reset," positioned on the right.
* **Relationships:**
* Miori connects to $a^*$ via a "mitigate-by" edge.
* Mirai connects to $a^*$ via a dashed "mitigate-by" edge.
#### Panel (c): $q^+$
* **Structure:** Enclosed within a grey rectangular box.
* **Nodes:**
* **DDoS (Red):** Top-left inside the box.
* **RCE (Red):** Bottom-left inside the box.
* **Miori (Blue):** Center inside the box.
* **"credential reset" (Green):** Right side inside the box.
* **Relationships:**
* DDoS connects to Miori via a dashed "launch-by" edge.
* RCE connects to Miori via a "launch-by" edge.
* Miori connects to "credential reset" via a "mitigate-by" edge.
#### Panel (d): $q \wedge q^+$
* **Structure:** A consolidated flow diagram.
* **Nodes:**
* **BusyBox (Orange):** Top-left.
* **PDoS (Red):** Middle-left.
* **RCE (Red):** Bottom-left.
* **$v_{malware}$ (Blue):** Center.
* **$v_?$ (Green):** Right.
* **Relationships:**
* BusyBox connects to $v_{malware}$ via "target-by".
* PDoS connects to $v_{malware}$ via "launch-by".
* RCE connects to $v_{malware}$ via "launch-by".
* $v_{malware}$ connects to $v_?$ via "mitigate-by".
### Key Observations
* **Logical Progression:** The diagrams move from a baseline model ($q$) in (a) to specific expansions ($q^+$) in (b) and (c), culminating in a logical conjunction ($q \wedge q^+$) in (d).
* **Convergence:** Panel (d) demonstrates the convergence of multiple attack vectors (PDoS and RCE) and targets (BusyBox) onto a single malware entity ($v_{malware}$), which is then mitigated.
* **Dashed vs. Solid Lines:** Dashed lines appear in panels (b) and (c) for specific relationships (e.g., Mirai to $a^*$, DDoS to Miori), potentially indicating indirect or secondary relationships compared to the solid lines.
* **Grey Box Grouping:** The grey boxes in (b) and (c) likely denote specific sub-modules or contexts within the broader threat model.
### Interpretation
The data suggests a formal logic framework used to model cybersecurity threats.
* **Panel (a)** establishes the fundamental relationship: Malware ($v_{malware}$) is targeted by BusyBox and launched by PDoS, and is subsequently mitigated.
* **Panels (b) and (c)** act as "positive" expansions ($q^+$), providing granular detail on specific malware strains (Miori, Mirai) and specific attack vectors (DDoS, RCE) that lead to a specific mitigation outcome (credential reset).
* **Panel (d)** represents the integration of these models. It shows that the threat model is additive; the specific attack vectors identified in the $q^+$ expansions are integrated into the baseline $q$ model. This suggests a system designed to build comprehensive threat profiles by combining general attack patterns with specific, observed malware behaviors.