\n
## Diagram: Attack Surface Evolution
### Overview
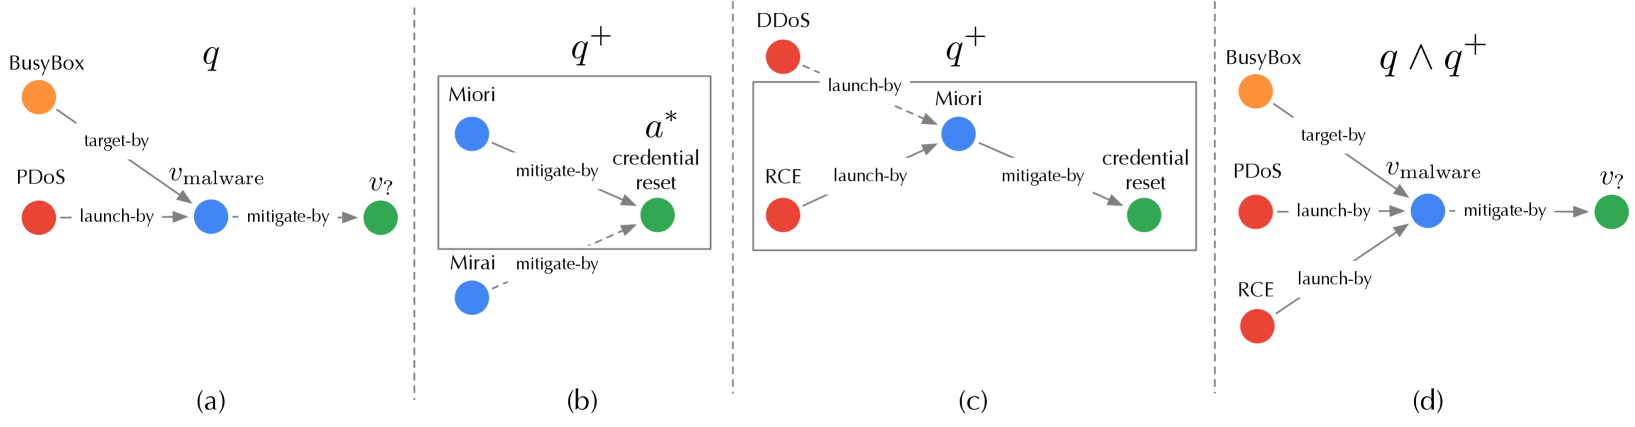
The image presents a series of four diagrams (a, b, c, d) illustrating the evolution of an attack surface over time. Each diagram depicts a network of interconnected components representing different entities involved in a cyberattack, along with the relationships between them. The diagrams show how the attack surface expands and changes with the introduction of new vulnerabilities and mitigation strategies.
### Components/Axes
Each diagram consists of nodes (circles) representing entities like BusyBox, PDDoS, Miiori, RCE, Mirai, and a credential reset component. Arrows between nodes indicate relationships such as "target-by", "launch-by", and "mitigate-by". Each diagram is labeled with a letter (a, b, c, d) and a mathematical expression representing the current attack surface state (q, q+, q ∧ q+).
### Detailed Analysis or Content Details
**Diagram (a): Initial Attack Surface (q)**
* **Nodes:**
* BusyBox (orange)
* PDDoS (red)
* v<sub>malware</sub> (unlabeled, light blue)
* Miiori (blue)
* **Relationships:**
* BusyBox "target-by" PDDoS
* PDDoS "launch-by" v<sub>malware</sub>
* v<sub>malware</sub> "mitigate-by" Miiori
**Diagram (b): Expanded Attack Surface (q<sup>+</sup>)**
* **Nodes:**
* Miiori (blue)
* α<sup>*</sup> credential reset (green)
* Mirai (blue)
* **Relationships:**
* Miiori "mitigate-by" α<sup>*</sup> credential reset
* Mirai "mitigate-by" α<sup>*</sup> credential reset
**Diagram (c): Combined Attack Surface (q<sup>+</sup>)**
* **Nodes:**
* DDoS (red)
* Miiori (blue)
* α<sup>*</sup> credential reset (green)
* RCE (red)
* Mirai (blue)
* **Relationships:**
* DDoS "launch-by" Miiori
* Miiori "mitigate-by" α<sup>*</sup> credential reset
* RCE "launch-by" α<sup>*</sup> credential reset
* Mirai "mitigate-by" α<sup>*</sup> credential reset
**Diagram (d): Further Expanded Attack Surface (q ∧ q<sup>+</sup>)**
* **Nodes:**
* BusyBox (orange)
* PDDoS (red)
* v<sub>malware</sub> (unlabeled, light blue)
* RCE (red)
* Mirai (blue)
* **Relationships:**
* BusyBox "target-by" PDDoS
* PDDoS "launch-by" v<sub>malware</sub>
* v<sub>malware</sub> "mitigate-by" Mirai
* RCE "launch-by" Mirai
### Key Observations
* The attack surface progressively expands from diagram (a) to (d).
* New attack vectors and components are introduced in each subsequent diagram.
* Mitigation strategies (represented by "mitigate-by" relationships) are employed, but often lead to new vulnerabilities or attack paths.
* The mathematical expressions (q, q<sup>+</sup>, q ∧ q<sup>+</sup>) likely represent the state of the attack surface at each stage, with 'q' being the initial state and 'q<sup>+</sup>' representing the addition of new vulnerabilities.
### Interpretation
The diagrams illustrate a dynamic and evolving attack surface. The initial attack (a) focuses on PDDoS launched via malware and mitigated by Miiori. As the system evolves (b), a credential reset component is introduced, offering a potential mitigation path. However, this introduces new attack vectors (c) with DDoS and RCE exploiting Miiori and the credential reset. Finally (d), the attack surface combines the initial attack with the new vulnerabilities, showing a more complex and potentially dangerous scenario.
The use of mathematical notation suggests a formal approach to modeling the attack surface and its evolution. The diagrams demonstrate that simply adding mitigation strategies doesn't necessarily reduce the overall risk; it can create new attack paths and vulnerabilities. This highlights the importance of a holistic security approach that considers the entire attack surface and the potential interactions between different components. The unlabeled node 'v<sub>malware</sub>' suggests a variable or unknown malware component, indicating the complexity and uncertainty inherent in real-world attack scenarios.